International Biotechnology Trust (IBT) is the oldest UK investment trust that specialises in the healthcare sector and it’s one of the most recent additions to my portfolio.
I’ve been following this trust for a couple of years but it wasn’t until this July that I took the plunge buying a small position in IBT plus similarly sized ones in Worldwide Healthcare and BB Healthcare.
I’ve gone into a little depth on why I like this sector for the long-term in those two linked articles so I won’t dwell on that in this piece.
Key Stats For International Biotechnology Trust
- Listed: 1994
- Manager: Carl Harald Janson (since Sep 2013, early 60s)
- Management group: SV Health Investors
- Ticker: IBT
- 10-year net asset return: +492%
- Benchmark: NASDAQ Biotechnology Index
- Current price: 847p
- Indicated spread: 844p-850p (0.7%)
- Market cap: £336m
- Net asset value (NAV): 839p
- NAV updated: daily (unquoted holdings updated quarterly)
- Premium to NAV: 1%
- Costs: 1.4% OCF including performance fee, 2.2% KID
- Management fee: 0.9% of NAV plus a performance fee
- Net cash: 0.4% (as of 30 Sep 2020)
- Number of holdings: 69 quoted plus 12% of assets in unquoted (mostly held via a fund)
- Latest dividend and yield: 24.8p and 2.9%
- Results released: Nov (finals) and Apr (interims)
- Dividends paid: Jan and Aug – set at 4% of NAV at the AGM in Dec
- Continuation vote: Every two years, next one in Dec 2021
- Sector: Biotechnology and Healthcare (2nd out of 4 over 10 years)
- Links: Website — AIC page — Quoted Data — Kepler — Citywire podcast
Based on price data as of 4 Nov 2020.
A difficult first few years
International Biotechnology has packed quite a lot into its relatively short life, with most of the drama taking place in its first decade. While it doesn’t have that much relevance to the trust as it’s run today, it’s a good illustration of just how volatile the sector has been in the past.
IBT joined the London market in May 1994, a year before Worldwide Healthcare was born and only a few months after the NASDAQ Biotechnology Index (NBI) was launched in November 1993 at a base level of 200.
For the first few years, the trust was managed by Rothschild Asset Management and it had a concentrated portfolio of fewer than 20 holdings.
Indeed, its first annual report listed just seven holdings although many of these names — such as Amgen, Genentech, and Incyte — went on to become very large companies.
But it was a difficult time for biotech investors with share prices making little headway for a number of years following the launch of the NBI.
The year to August 1998 was a disastrous one for International Biotechnology’s share price. It fell from 100.5p to 33.5p after diversifying into the fledging UK biotech scene. One large UK-listed holding, Biocompatibles, lost 94% of its value that year.
Activists take an interest
A wide discount to net assets opened up at IBT, leading to activist investors like Millennium Partners and George Soros’s Quantum Fund building up sizeable positions.
A merger with a company called Biotechnology Investments Limited (which eventually become the short-lived 3i Bioscience Investment Trust) was considered. However, that idea was abandoned when Rothschild Asset Management said it was looking to withdraw from managing assets in this space.
The Rothschild biotech team considered setting up a new firm and discussions began about them taking over the management of the trust.
Around this time, it became apparent that the trust’s lead manager had been given share options in some of the companies that the trust had invested in. This led to even more pressure from the activist investors.
Rothschild Asset Management got a new CEO who decided that he wanted the firm to continue in biotech investment after all. So IBT stuck with Rothschild for a little longer.
Biotech boom #1
As Y2K approached, biotech share prices went full-on crazy, boosted by the excitement surrounding the Human Genome Project.
In the year to August 2000, the trust “delivered an exceptional 485% rise in share price alongside a 382% rise in the diluted net asset value per share”. That makes this year’s performances from the likes of Scottish Mortgage and Baillie Gifford US Growth look positively pedestrian!
The trust’s lead manager ending up resigning in June 2000 for health reasons but it was agreed that any profit from his options in the portfolio companies would be paid back to the trust.
The activists forced a tender offer as IBT was still trading a double-digit discount. They and other shareholders also persuaded the board to look for a different fund management team.
SV enters the fray
Schroder Ventures Life Sciences (now known as SV Health Investors) was appointed as IBT’s investment adviser in November 2000 with Schroders performing the admin functions. However, the 1.35% annual fee with a performance element on top did nothing to please the activists.
A massive 48% of the trust’s shares ended up being bought back when the tender offer eventually took place in early 2001.
The year to August 2001 saw a savage pullback, with IBT’s share price falling 46%.
The NBI was equally volatile around this time. It went from around 250 in August 1998 to nearly 1,600 in February 2000 and then back down to the low 400s by June 2002.
The NBI doubled from 2002 to 2008, rising at a steady but unspectacular rate throughout, before losing about a third of its value in the global financial crisis.
Biotech boom #2
From early 2009 to the summer of 2015, a second biotech surge took place with the NBI rising from just over 600 to just over 4,000.
The larger biotech stocks saw both their sales and profits rise rapidly over this period and investors got a little too excited about their long-term prospects.
2016 saw a slump, though, partly due to political concerns about drug prices.
Another steady recovery in biotech shares followed but it was only earlier in 2020 that the NBI exceeded 4,000 again. As I write this, the NBI sits at 4,430.
IBT went about its business fairly quietly for many years after the switch from Rothschild Asset Management. In April 2013, David Pinniger, who had managed the trust for about five years resigned and joined Polar Capital (he now manages Polar Capital Global Healthcare Trust).
It’s a little difficult to make long-term comparisons against the sterling version of NBI going back this far, but in the five years to August 2013, I reckon the trust’s net asset value rose 95% while the NBI increased 168%.
That doesn’t exactly match up with Pinniger’s tenure but it does seem that International Biotechnology lagged its benchmark as the sector surged ahead in the early 2010s.
Now we’ve dealt with that rather protracted backstory (sorry – got rather carried away there!), it’s time to look at the trust’s current incarnation.
IBT’s current management team
Pinniger’s replacement was Carl Harald Janson who took over a few months later in September 2013. He was a medical doctor in Sweden from 1981 to 1997 before moving into the world of investment.
Janson ran the Stockholm-based Carnegie Biotechnology fund from 2000 to 2007, earning a 54% return while the NBI declined 26%. He then held various other positions before joining IBT.
He is supported by Ailsa Craig, who helped manage the trust in the few months before his appointment and who has been at SV Health since 2006.
Marek Poszepczynski is another named investment manager; he specialises in company analysis and joined SV in 2014.
The unquoted side of IBT is managed by Kate Bingham, who is a managing partner of SV Health and has been involved with the trust since the switchover from Rothschilds.
She is perhaps best known these days as the head of the UK’s COVID-19 vaccine task force, which has recently resulted in some controversy. She was appointed in May 2020 on a six-month engagement but there’s obviously plenty of work left to do in this area (or maybe not?)
Janson, Craig, and Poszepczynski seem to take turns doing the media and presentation duties but Janson retains ultimate responsibility for the trust’s portfolio. As far as I can tell, this trio just looks after IBT and aren’t involved with SV’s other funds.
There definitely seems to have been a concerted effort to raise the trust’s profile among retail investors in the past couple of years. Alongside regular media appearances, there is also a very slick-looking website that was relaunched a few months ago.
The trust’s performance certainly seems to have stepped up a gear since Janson took the reins. In the seven years to 31 August 2020, the trust’s NAV rose 171% versus 149% for the NBI in sterling.
IBT’s share price increased by 219% over those seven years, as its discount has narrowed from 10%-ish to zero, in part due to the introduction of a new 4% dividend policy.
A little on SV Health Investors
SV Health was part of Schroders until 2001, I believe, so it’s been independent for nearly two decades now. IBT is the only investment trust that it runs and it doesn’t seem to have any other funds that are open to retail investors.
It mostly invests in private companies via half a dozen venture capital funds and IBT has a stake in one of these funds.
SV Health has $2.2bn in assets under management, so IBT represents about a fifth of that. It has offices in Boston and London and around 50 investment professionals.
Since 1993, SV Health reckons that 75 of the 175 private companies it has invested in have either been acquired or become listed.
IBT’s investment objective
IBT’s stated objective is “to achieve long-term capital growth by investing in biotechnology and other life sciences companies”.
In past articles, I’ve said that biotech covers products derived from living organisms. However, in a recent ii podcast, Ailsa Craig said that while this was the traditional scientific definition, financial markets tend to use the phrase more loosely to mean younger, more innovative drug development companies, rather than the traditional industry giants like Pfizer, Merck, and GlaxoSmithKline.
The trust says it invests “in a diversified portfolio of companies which may be quoted or unquoted and whose shares are considered to have good growth prospects, with suitably experienced management and strong potential upside through the development and/or commercialisation of a product, device or enabling technology”.
IBT also considers “related sectors such as medical devices and healthcare services” and looks to diversify “by geography, industry sub-sector and investment size”.
IBT’s portfolio
IBT is heavily weighted towards the US, as that is where most major quoted biotech companies are listed.
Here’s the portfolio summary from the trust’s latest annual report:
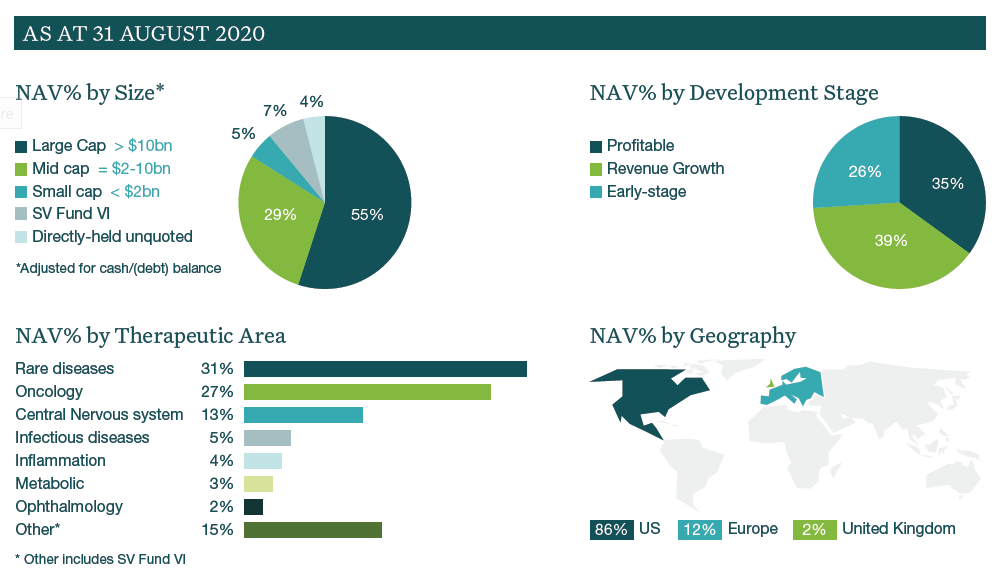
IBT focuses on the three areas in particular that it thinks offers the best long-term opportunity: rare diseases, cancer treatments, and central nervous systems.
Although over half the trust is invested in what are deemed to be large-cap companies valued at $10bn+, only 35% of the portfolio by value are currently producing profits.
One notable gap is Asia, which I was under the impression was growing in importance in this sector. The 2020 annual report doesn’t mention China and only mentions Asia once, but only in the context that the trust has the capacity to invest there.
Mergers and acquisitions continue to remain a key driver in the sector, with larger firms snapping up smaller ones to fill holes that occur in their product pipelines as their main drugs lose their patent protection.
IBT’s holdings have received 15 takeover bids in the last three years at an average premium of 72%. Four of these have taken place in the last few months, although this may have been a catch-up effect as takeover activity was effectively put on hold in the first half of 2020 due to COVID.
Although the quoted part of the portfolio has around 70 holdings, it is actually quite concentrated.
The September 2020 factsheet says the top 10 accounted for 46% of its NAV and the largest position was Horizon at 7.7%. The annual report lists a long tail of 29 companies that each accounted for less than 1% of NAV.
There are several names I recognise looking down the portfolio but most of the companies are unfamiliar to me. However, even where I know a little bit about a company in this sector, assessing its prospects is way above my pay grade.
This is a very specialist area of investing, where traditional metrics like profits, cash flow, and return on capital employed aren’t much use.
Portfolio turnover is very high, at around 100% in the last two years. That’s because IBT tries to avoid holding large positions ahead of the results of key drug trials. These are often binary events for all but the largest biotech firms and IBT’s investment team reckons they offer a poor risk-reward ratio.
Investors often bid up prices before this type of news event, so the pop from any better-than-expected outcome can be relatively small relative to any slump that occurs when a trial result disappoints.
Unquoted investments
IBT currently has 12% of its portfolio in unlisted investments. In 2016, it decided that all new unquoted investments should be made through SV’s venture capital funds but it still has some legacy positions that it owns directly.
SV Life Sciences Fund VI accounts for 7.6% of IBT’s NAV. This fund owns 25 investments of which four are now listed.
IBT made an initial commitment of $30m to SV Fund VI of which around $8m is outstanding. The IRR on the fund to date is 21%, so it seems to be adding value although I’m not sure if that IRR figure takes costs into account.
The trust also has 5 investments in companies where it has already exited but there are contingent payments due based on future milestones. These contingent payments are valued at 3.4% of NAV. Another 1.3% of NAV is made up of the remaining 11 directly-held positions.
It seems to make sense for IBT to invest in unquoted companies via SV’s other funds. The main question for me would be whether the exposure is large enough to be meaningful. IBT’s board has said it expects the unquoted portfolio to remain in the guideline range of 5-15%.
Performance
The NBI is the trust’s key benchmark although it sometimes uses the FTSE All-Share as a replacement comparator, especially when presenting long-term return figures.
In such cases, IBT says “the FTSE All-Share Index Total Return has been used … as the NBI has a lack of diversity within its constituents”.
The NBI is a modified market-cap weighted index that currently consists of around 200 companies and is rebalanced on a quarterly basis. The top five market caps (currently Amgen, Gilead, Vertex, Regeneron, and Illumina) have a maximum weight of 8%. Companies outside the top five are allowed a maximum weight of 4%.
So I’m not sure that the NBI is that much less diverse than IBT’s portfolio, certainly when it comes to position sizes. And it seems very odd to exclude the benchmark your performance fee is calculated on.
That bit of griping done, here’s the 10-year summary from the latest annual report:
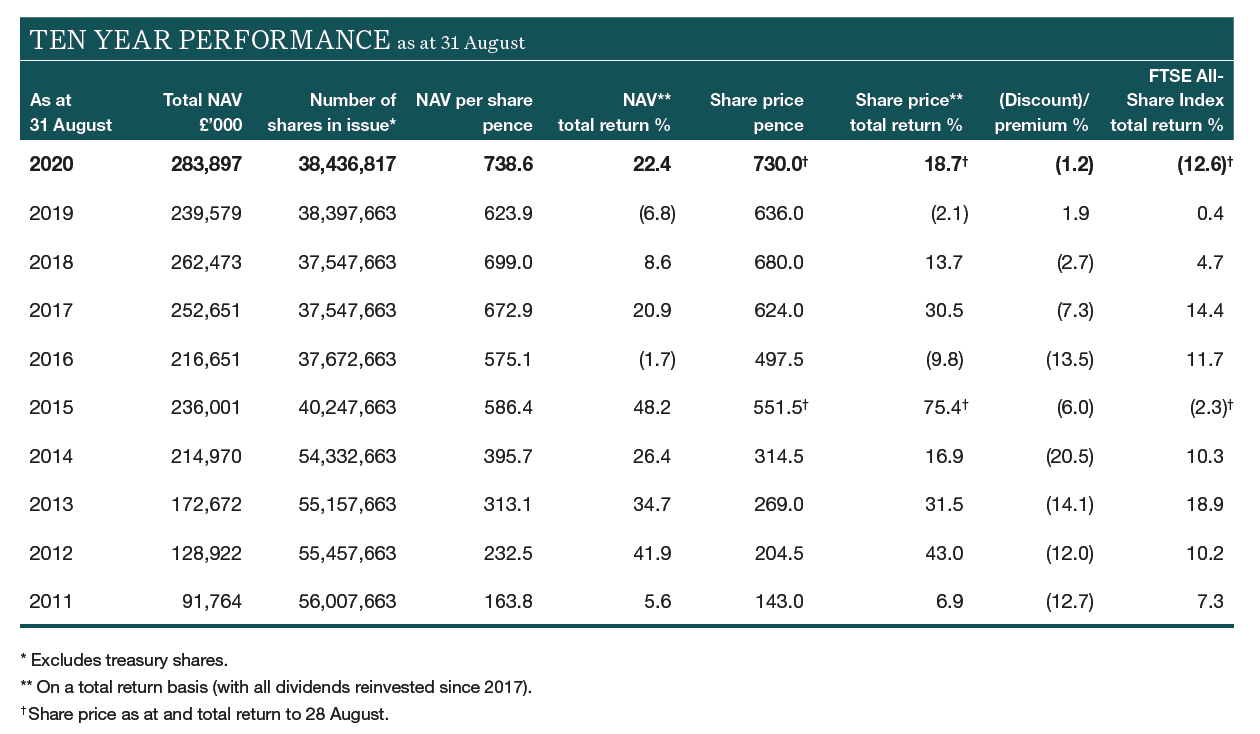
You can see how the introduction of the dividend has shaken off the long-term discount IBT traded at. Previously, the trust was a fairly major buyer of its shares instead.
The difference in performance between the first and second halves of the 2010s is also very apparent.
IBT has performed on a very similar basis to the two Orbimed trusts — Worldwide Healthcare and Biotech Growth — since Janson was appointed:
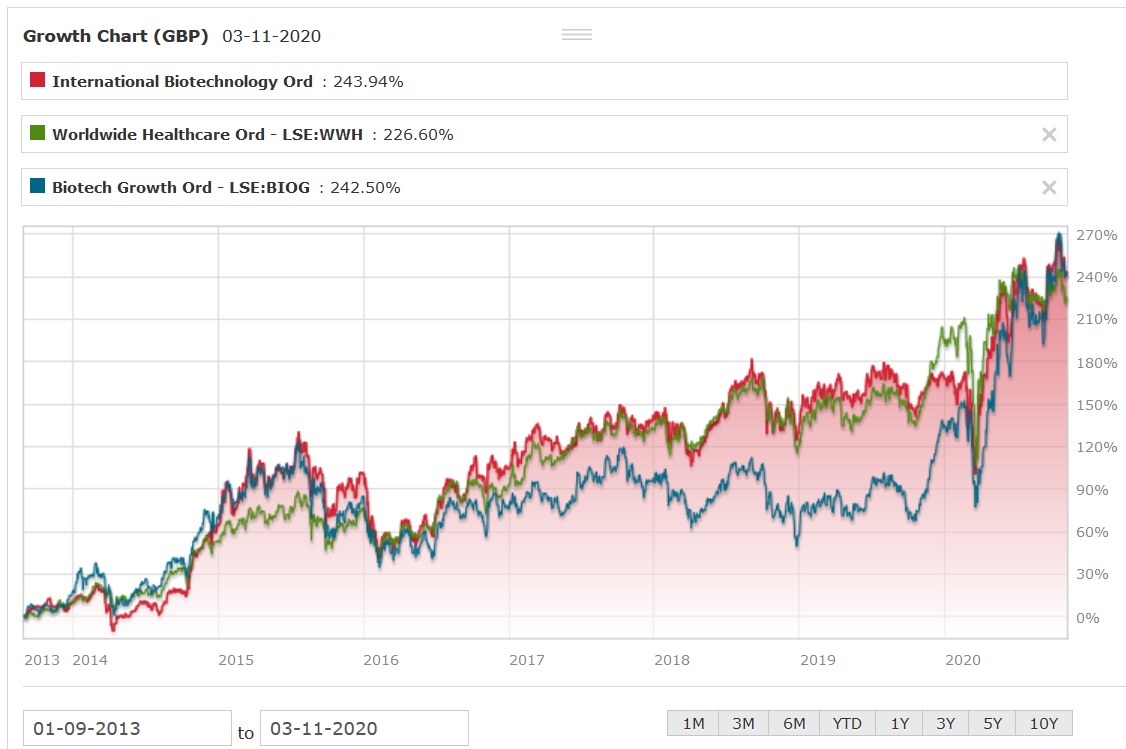
Over the very long term, you would probably expect both IBT and Biotech Growth to perform slightly better than Worldwide Healthcare but to be more volatile. The latter is more diversified into other parts of the healthcare sector which tend to grow more a little more slowly than pure biotech.
However, the chart shows that Biotech Growth had a lean few years from 2016 to 2019 but has had a spectacular 2020. I suspect IBT’s strategy of sitting out those binary bets has made it a little less volatile than Biotech Growth.
Dividends
No dividends were paid by the trust prior to 2017.
Then, in an effort to reduce the trust’s discount to net assets and to widen its appeal to retail investors, a policy of paying a 4% dividend each year was introduced.
Few of the companies held by the trust pay dividends themselves (the income received last year was £1m versus dividends paid out of £10m) so most of the payout comes from past capital gains.
The 4% dividend level is set based on the total net asset value of the company at the end of August and then divided among the number of shares in issue in December when the AGM takes place and the dividend payment is approved by shareholders. It is then paid via two equal amounts the following January and July.
Of course, this does mean dividends can fall, as indeed they did last year. Two 14p dividends were paid in 2019 but this dropped to two 12.4p payments in 2020.
2021 should see two payments of between 14.5p and 15.0p. The exact payment is usually announced after it is approved at the trust’s AGM in December (update: the actual 2021 dividend ended up being two payments of 14.2p per share as a large number of new shares were issued between 31 August and the date of the AGM).
Gearing
IBT says it “may borrow from time to time to exploit specific investment opportunities, rather than to apply long-term structural gearing to the Company’s portfolio”.
The maximum borrowing limit is set at 30% of NAV but the current facility (a £55m overdraft with HSBC) would only represent gearing of 16-17%.
There was a little gearing (6%) at the year-end on 31 August 2020 but this had moved to 2% net cash by 30 September 2020.
According to Kepler, “gearing is the responsibility of Janson and is used tactically. [He] aims to build up gearing after a market pullback and when volatility is high. That said, he keeps a macro overview. Currently, given the unpredictability that can go with US presidential elections, gearing is being used selectively”. I expect that explains the sudden move to net cash in September.
The cash position rose to about 4% in February 2020, as IBT’s sector expertise gave them a heads-up as to the severity of COVID-19.
Charges
Specialist trusts like this often tend to be more expensive than plainer equity trusts and that’s certainly the case here.
The base management fee is 0.9% but the performance fee and high level of transaction costs push things up a little further.
The performance fee on the quoted portfolio is set at 10% of any outperformance of the NBI, with a hurdle rate of 0.5% a year. Any underperformance is carried forward for the next two years.
On the unquoted side, the performance fee is 20% of net realised gains less any unrealised losses.
The total performance fee is capped at 2% of NAV but it’s come in a lot less than that in recent years.
£0.24m of performance fees were paid in 2020 and £0.97m in 2019. By way of comparison, the management fees for those years were £1.9m and £1.6m respectively.
Performance fees were payable in 2015, 2016, 2017, and 2018 coming to a grand total £3.4m. No performance fee was paid in 2014, the first year of Janson’s tenure, although I suspect that may have been due to some carried-forward underperformance.
The KID costs are 2.2%, although the document that comes from dates back to June 2019. This total breaks down into 0.75% for transaction fees, 1.18% for ongoing costs, and 0.28% for performance fees.
The base management fee was last reduced in March 2015, from 1.15% to 0.9%. Net assets have risen by 40% since then, so a further review would be rather welcome.
Of course, you can get an ETF if you just want to track the NBI at a low cost. SBIO has an annual charge of 0.4%, for instance.
Skin in the game
Two new directors were recruited in 2020, taking the total to six. But IBT’s Chairman is retiring next month and the senior non-executive director is leaving in 2021.
There’s plenty of investment trust and financial services experience among the directors but the two leaving soon seem to have the most direct industry experience.
The directors own around 150,000 shares between them at the moment (£1.3m) but this will drop to around 80,000 (£0.7m) by the end of 2021, assuming there are no changes in the number of shares held by the remaining four.
There’s no information on the holdings of SV Health’s partners or employees.
In summary
When I was looking for exposure to this sector, the more diversified and larger Worldwide Healthcare seemed like the obvious first choice. But there’s been little to choose between IBT and Biotech Growth since Janson took charge of the former in 2013.
In the end, for me, the deciding factors were hedging my bets across different management firms (as mentioned previously, Worldwide and Biotech Growth are both run by OrbiMed) and the fact I had seen the IBT present many times over the last couple of years so I reckoned I had a better feel for how they viewed the sector.
My position size here is still fairly small given the black-box nature of biotech investing. I suspect I might build it up a little more over time, although a sustained period underperforming the NBI would give me pause for thought.
The charges are a concern so it would be good to see some commitment to lowering them now the trust is getting larger.
Disclaimer
Please note that I may own some of the investments mentioned above -- you can see my current holdings on my portfolio page.
Nothing on this website should be regarded as a buy or sell recommendation as I'm just a random person writing a blog in his spare time and I am not authorised to give financial advice. Always do your own research and seek financial advice if necessary!
Subscribe to IT Investor
Get an email alert every time I publish a new article. Your email address won't be used for anything else.
A new research report on this trust from Quoted Data was published this morning:
https://quoteddata.com/research/international-biotechnology-trust-healthy-returns-qd/
So what are the disadvantages of going with SBIO instead?
It’s the usual trade-off with any passive vs active approach I’d say.
The return from the passive fund should closely match the index it’s designed to track, less a little each year for costs.
Active trusts like IBT and BIOG give you the chance of better performance but there’s a risk that you might underperform as well.