Costs are one of the few things we can control as investors. They have a massive impact on your long-term returns, too. While you could say performance is ultimately all that matters, I’d still say costs should be a key factor when choosing where to invest.
In a recent article, I looked at the basics of charges for investment trusts. Monevator covered this topic recently as well, hopefully raising the profile of this issue considerably.
It’s one of those areas that, the more you look at it, the more confusing and frustrating it seems to become.
Two measures… but many problems
We currently have two main measures of investment trust costs.
The first is the most widely used — it’s called the ongoing charge figure or OCF.
However, the OCF leaves a lot out: performance fees, interest costs, trading charges, and the cost of other funds that your trust invests in.
Those omissions are why we have a second measure, courtesy of the Key Information Document (KID) that is now required by EU legislation.
The KID figure includes pretty much everything, but it’s often hard to find, being hidden away in a PDF in an obscure corner of an investment trust’s website.
The top 20 investment trusts compared
Using the AIC’s list of the 20 most viewed investment trusts on its website, I reviewed their KIDs to see which companies are keen to be transparent and which just seem to be phoning it in.
I’ve also added the OCFs to see just how big the difference between the two can be.
| Trust | Trading | Other | Manage- ment | Perform- ance | Other funds | Interest | Total per KID | OCF |
|---|---|---|---|---|---|---|---|---|
| Scottish Mortgage | 0.04 | 0.07 | 0.30 | – | 0.02 | 0.38 | 0.81 | 0.37 |
| Independent Investment Trust | -0.08 | 0.25 | – | – | 0.07 | – | 0.24 | 0.25 |
| Murray International | 0.09 | 0.99 | – | – | – | – | 1.08 | 0.64 |
| City of London | 0.08 | 0.85 | – | – | – | – | 0.93 | 0.41 |
| F&C Investment Trust | 0.13 | 0.99 | – | – | – | – | 1.12 | 0.52 |
| European Assets | 0.16 | 1.07 | – | – | – | – | 1.23 | 1.06 |
| Finsbury Growth & Income | 0.20 | 0.80 | – | – | – | – | 1.00 | 0.67 |
| Allianz Technology | 1.70 | 1.02 | – | 0.28 | – | – | 3.00 | 1.15 |
| Merchants | 0.09 | 0.22 | 0.35 | – | – | 1.18 | 1.84 | 0.58 |
| Edinburgh Investment | 0.06 | 1.24 | – | – | – | – | 1.30 | 0.57 |
| Bankers | 0.11 | 0.85 | – | – | – | – | 0.96 | 0.44 |
| Alliance Trust | 0.01 | 0.88 | – | – | – | – | 0.89 | 0.62 |
| JPMorgan Global Growth & Income | 0.45 | 0.66 | – | 0.42 | – | – | 1.53 | 0.56 |
| Edinburgh Worldwide | 0.03 | 0.17 | 0.64 | – | 0.02 | 0.26 | 1.12 | 0.81 |
| Temple Bar | 0.08 | 0.50 | – | – | – | 0.60 | 1.18 | 0.49 |
| Witan | 0.20 | 1.50 | – | 0.20 | – | – | 1.90 | 0.86 |
| Invesco Perpetual Enhanced Income | 0.13 | 1.36 | – | – | – | – | 1.49 | 1.38 |
| Henderson Far East Income | 0.46 | 1.20 | – | – | – | – | 1.66 | 1.08 |
| BMO Global Smaller Companies | 0.08 | 1.07 | – | – | – | – | 1.15 | 0.59 |
| RIT Capital Partners | 0.08 | – | 0.66 | 1.81 | 1.16 | 0.46 | 4.17 | 1.02 |
Big differences between KIDs and the OCF
Look at the OCFs and you’ll see that 15 of them are below 1%. But with the KID version of costs, only 5 can make that claim.
And there are many trusts where the KID costs are a whole percentage point or more than the OCF version.
I suspect interest charges are a big part of the reason why. Most of these funds use borrowing to enhance their returns, but few of them have taken the trouble to break down their costs to make this clear.
The average level of gearing is about 8%, which admittedly doesn’t sound like much. But Scottish Mortgage’s 9% level of gearing adds an extra 0.4% to its costs, while Merchants’ 18% adds nearly 1.2%. So it doesn’t take that much borrowing to jack up a fund’s costs.
As markets tend to rise over time, the gearing effect should boost returns by more than these interest costs.
But it’s still a figure I’d like to see broken out. Sadly, in many KIDs, almost every expense is lumped into one category simply called “other ongoing costs”.
That’s just not very helpful.
Top marks for Baillie Gifford
A notable exception is Baillie Gifford, who have fully broken down the costs for Scottish Mortgage and Edinburgh Worldwide. And their costs are also among the lowest, so double sticky gold stars!
Independent Investment Trust, Temple Bar and Witan also provide a little more colour than most.
RIT Capital Partners is another providing a pretty full breakdown, presumably as they felt a little explanation was needed to justify their 4.17% annual charge!
The rest of the top 20… not so good.
As a general observation, self-managed trusts seem to be doing a much better job of providing more detail in their KIDs, while the bigger fund groups are lagging behind.
Er, negative trading charges?
The AIC highlighted the fact that the trading charge calculation was a bit screwy in their 40-page demolition of the KIDs called ‘Burn Before Reading’:
If the price has risen in the time between an order being placed and the transaction being completed, the difference is added to the other costs. If the price has gone down in this period, the difference is subtracted from other costs. Where downward movements in the price paid are large, or consistent across many orders, the amount subtracted from the total of the transaction costs can result in negative costs.
I’m guessing this situation might arise when a trust decides to buy or sell a significant number of shares and the whole order takes a few hours or even days to complete. Price moves in this time might get counted as part of the trading cost figure.
The AIC reckons 1 in 10 KIDs they looked at had negative trading costs as a result of this perverse requirement, which obviously makes a mockery of the figures.
Similarly, 3 out of the 20 I looked at had the same problem, at least initially.
Both Allianz Technology and Merchants (also managed by Allianz) had negative trading costs in the KIDs I first looked at for this piece. Then, when I checked their KIDs again a few days later, the trading charges were now positive, leaving Independent Investment Trust as the only fund with a negative trading charge.
The case of Allianz Technology is particularly strange. Trading costs of -0.70% became 1.70% the second time I looked.
The dates of the two documents I examined were just two weeks apart (15 and 31 January), so I presume there has been a methodology change here rather than an actual movement of this magnitude.
Something doesn’t add up
Allianz Technology is also unusual in that it states total costs as 3.61% but the breakdown only comes to 3.00% (which is the figure I’ve used in my table).
I have only seen this happen in one other instance, with Caledonia Investments.
Caledonia very helpfully provides an additional document explaining why there are differences between its KID cost and its OCF.
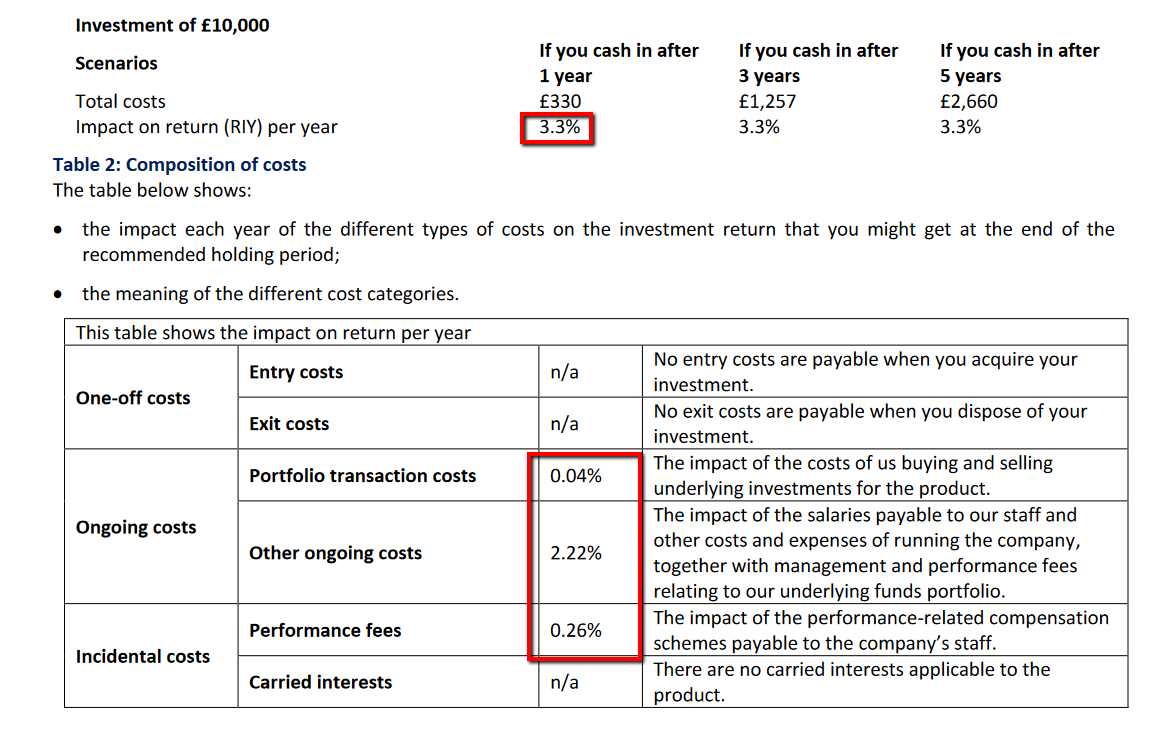
It also highlights that the total cost figure — labelled as ‘impact on return’ or ‘reduction in yield (RIY)’ on the KID — is based on the share price while the cost breakdown shown below it is based on net assets.
As Caledonia has recently traded on a discount of 15-20%, charges represented as a percentage of the share price are greater than as a percentage of net assets.
This results in quite a difference, as this the screenshot below shows. The total is 3.3% but the breakdown beneath it adds up to 2.52%
I haven’t seen this anomaly explained elsewhere although I may just have missed it. While I follow the logic, it seems there might be some inconsistency across the industry in how these two sets of figures are presented.
Whatever it is going on here, it would be great to see other trusts follow Caledonia and provide more information for shareholders on how to reconcile the various figures.
Must try harder
I can understand why investment trusts aren’t keen on KIDs. The risk indicator and performance scenario sections are clearly of little use, and to make matters worse, they are presented before the cost section.
What’s more, lobbying by the industry may see some changes being made, and I’m not sure what happens to the whole process should we leave the EU.
But it would be great to see investment trust boards take the initiative and publish actual trading costs that are paid out by the fund in cash terms.
Portfolio turnover figures, so we can see what proportion of a trust’s assets have been bought and sold in the past year would also be a welcome piece of transparency.
Separate disclosure of interest costs also seems like an easy win.
This looks like an issue that will run for some time yet, so I reserve the right to get into these weeds again!
Disclaimer
Please note that I may own some of the investments mentioned above -- you can see my current holdings on my portfolio page.
Nothing on this website should be regarded as a buy or sell recommendation as I'm just a random person writing a blog in his spare time and I am not authorised to give financial advice. Always do your own research and seek financial advice if necessary!
Subscribe to IT Investor
Get an email alert every time I publish a new article. Your email address won't be used for anything else.