The recent furore about plunging power price forecasts meant I looked at the latest numbers from Bluefield Solar Income Fund more closely than usual.
Bluefield is one of the oldest renewable energy infrastructure trusts and currently has the best 5-year performance figure (up some 80%). It has 50 solar sites, which receive varying levels of subsidy, mostly across Southern England.
Unlike many other funds in this sector, it’s been relatively cautious on the acquisition front in the last few years putting more emphasis on improving the underlying performance of its solar assets.
Indeed, up until quite recently, following a bumper set of final results plus a special dividend, Bluefield was one of the holdings in my portfolio that I was least concerned about.
Its shares rallied strongly from October 2019 to January 2020 (for a renewable energy trust anyway). Then those gains were wiped out in a just a few days after a couple of analysts raised the spectre of what falling power prices might do to both asset values and dividends across the sector.
Since then, of course, worries about the coronavirus have taken centre stage and many of my other positions have taken similar hits. In the carnage of last week, Bluefield was my best performer and even recorded a small gain.
Key stats for Bluefield Solar Income Fund
- Listed: July 2013 at 100p
- Manager: James Armstrong/Bluefield Partners
- Ticker: BSIF
- Target: Aims to grow dividends at RPI
- Recent price: 136.75p
- Indicated spread: 136.5p-137p (0.4%)
- Exchange market size: 3,000
- Market cap: £507m
- Net asset value: £447m / 120.75p per share as of 31 Dec 2019
- Premium to net assets: 13.3%
- Costs: 1.07% OCF, 1.4% KID
- Gearing: 32%
- Current dividend and yield: 7.9p (year ended June 2020 target) and 5.8%
- Results released: Mar (interims) and Sep (finals)
- Dividends paid: Feb, May, Aug, Nov
- Sector: Renewable energy infrastructure
- Links: Website and AIC page
- Videos: IG interview with Neil Wood (FD) — Results presentation
Starting at the end
There’s typically a lot of detail in Bluefield’s result statements, which is commendable. But let’s skip straight to the Chairman’s conclusion (with my bold):
The performance of the Company over the first six months of this financial year has once again been highly pleasing. The valuation now reflects the lower end of the market conditions that have been with us for some time and the strong earnings for the period, if continued for the full year, should translate into a sector leading dividend.
But, as I noted earlier, whilst we have again exploited higher than average irradiation due to the portfolio continuing to perform very well and we will continue to benefit from the power sales strategy that locked in very attractive power contracts, if wholesale electricity prices remain subdued it will at some stage restrict our ability to grow the dividend in line with RPI.
It is not an immediate concern and, indeed, the Company is the highest dividend payer in its sector by a significant margin, a dividend that is covered by earnings and is post debt amortisation. The Board is committed to continuing to be a high dividend payer but is also conscious of the desire of many shareholders to see the Company grow again as we look to continue to play a material role in the evolution of the UK’s energy market.
The Board and the Investment Adviser are currently evaluating how to manage these two priorities in the best interests of our shareholders, and I look forward to updating you on our conclusions.
That’s quite an admission regarding the dividend. While it’s reassuring to see it being highlighted rather than ignored, Bluefield does seem more vulnerable than most other renewable energy trusts in this regard.
The power price puzzle
There’s some disagreement about where power prices might go over the next few decades — more so than usual that is.
Bluefield and other renewable energy trusts use a blend of independent forecasters that expect them to be broadly flat. But one forecaster, not included in these blended views, has a rather different opinion.
A chart from Bluefield’s results presentation makes this a little clearer:
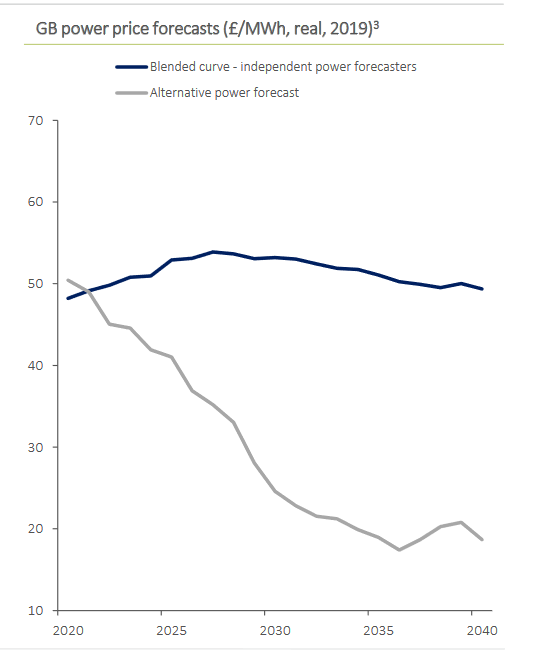
One of these lines is not like the other.
Long-term forecasts are exceedingly tricky of course and it will be a few years before we can get a decent idea of which of these is proving more accurate.
Bluefield was fairly scathing about the merit of these long-term forecasts in its results presentation highlighting how it’s difficult to forecast what power prices will be next week let alone in 30 years. You could almost sense a little frustration as James Armstrong argued that management would be able to take action to improve the trust’s performance if such a situation unfolded.
Here’s Bluefield’s take on what’s happening right now with power prices:
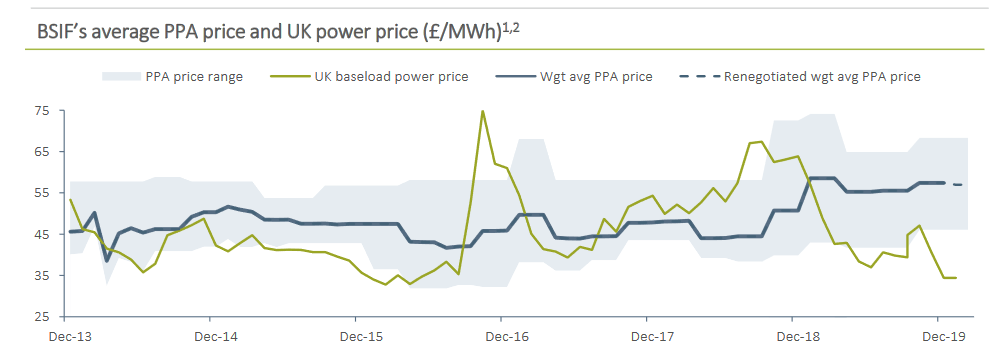
The blue line is what Bluefield receives through its various power price agreements (PPA) while the green line is the daily market price, which has fallen considerably over the past year.
Its power contracts typically cover between 1 and 3 years so this smoothes out the average price Bluefield gets. As you might expect, it largely follows market movements with a delay.
Bluefield was able to take advantage of the steady rise in market prices during 2018, leading to its average PPA price jumping from £46 to £56 in early 2019.
But if market prices continue to stay at the £35 level, or fall further, then the average PPA figure could begin to come down again. The chart shows that it’s rarely been below £45 since Bluefield was listed in 2013, so a drop of this magnitude would be uncharted territory.
Bluefield says it managed to fix the majority of its portfolio for 2 years in September 2018 so it might not be until the next set of interim results are published in February 2021 that we begin to see this happening.
It’s important to realise that the effect of this is muted by the fact that power prices only account for around 40% of total revenues (the remainder coming from subsidies).
Bluefield’s sensitivity analysis states that a 10% fall in power prices translates to a 5% drop in net asset value.
Asset values under pressure
Most other renewable energy trusts have now reported their net asset values for 31 December 2019 and there were falls pretty much across the board because of reduced power price forecasts.
Here’s a summary of the main six established trusts:
| NAV | BSIF | FSFL | NESF | TRIG | JLEN | UKW |
|---|---|---|---|---|---|---|
| 30 September 2019 | 118.0p | 109.1p | 111.2p | 115.0p | 104.7p | 122.9p |
| 31 December 2019 | 120.8p | 103.6p | 106.1p | 115.0p | 101.8p | 121.4p |
| Discount rate used | 6.5% | 7.1% | 7.0% | 7.25% | 7.5% | 7.5% |
The first three, Bluefield, Foresight, and NextEnergy are all just solar.
Renewables Infrastructure (TRIG) is a mixture of mostly wind with some solar.
JLEN is also mixed but more broadly with wind, anaerobic digestion and waste/wastewater in addition to solar.
Greencoat (UKW) is all wind.
Geographically, Bluefield and Greencoat are all UK-focused, while Foresight, NextEnergy, and JLEN have a little non-UK on the side. TRIG is nearly half non-UK and by far the most geographically diverse.
Dicing with discount rates
One of the concerns raised by analysts is that the reduction in asset values due to falling power prices is being masked by extensions to asset lives and lower discount rates used to value future income streams.
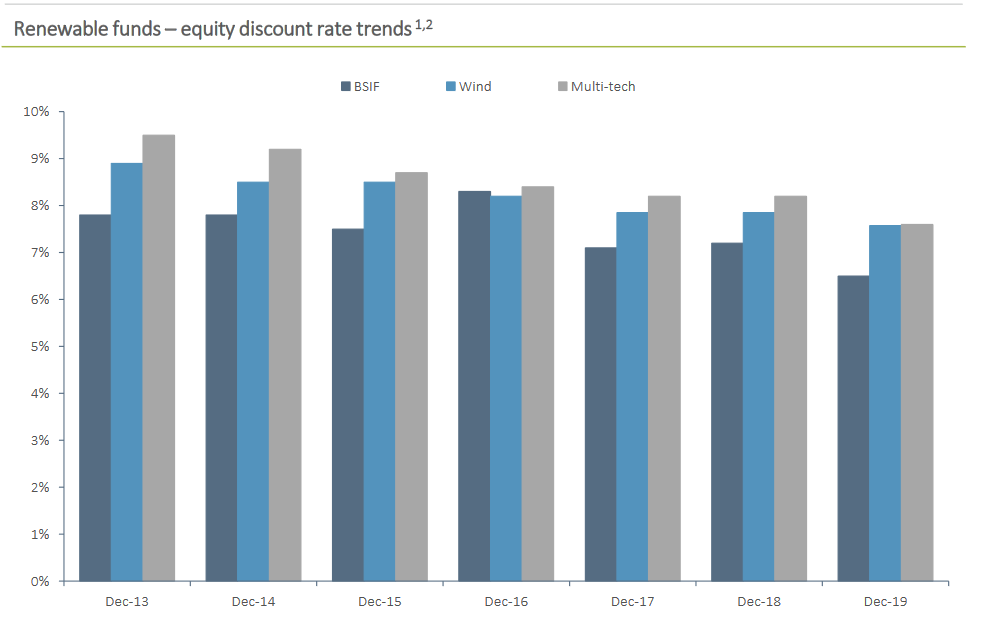
While Bluefield seems quite upfront about this, it significantly reduced its discount rate from 7.2% to 6.5% in these results. Most of the other trusts reduced theirs as well, but not to the same extent.
However, it seems that Bluefield has used a lower rate than most other trusts for a while now. It justifies this by pointing out that solar energy output tends to be less volatile than wind and also has lower operating and maintenance costs:
One of the more reassuring things about Bluefield’s valuations is that it compares the result of all its various assumptions to the prices paid for UK solar farms.
Its latest calculation resulted in a value of £1.31m/MW. While this looks reasonable based against past transactions, so few have been conducted in the last 12-18 months it’s becoming tougher to tell if this remains a decent yardstick:
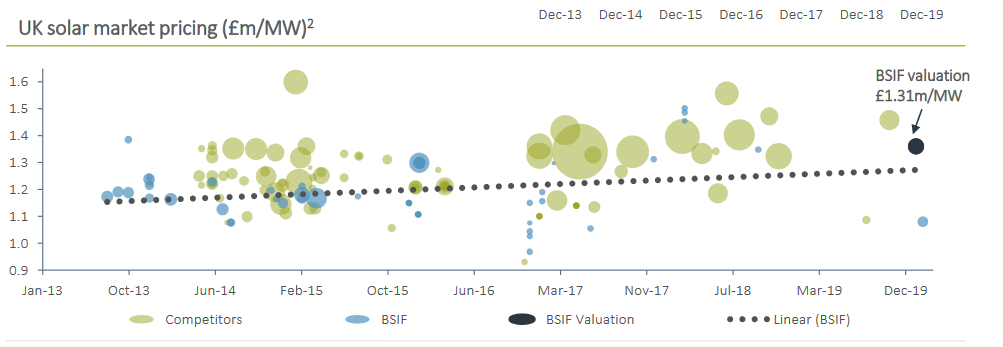
The chart above shows two small deals at around £1.10 (inlcuding the one done by Bluefield) and a larger one at around £1.45.
Asset life extensions
Good progress is still being made here, with a programme to extend the standard 25-year leases to 40 years across Bluefield’s larger sites.
37% of the portfolio has now been extended to 40 years while a further 10% is being reviewed by the planning authorities. Negotiations on another 40% are underway.
The success rate has been 100% so far, which gives some confidence that a potential further 7p increase in asset value per share mentioned could be realised.
A couple of potential negatives
However, balanced against this potential increase, 3p per share could be knocked off as a result of Ofgem’s Targeted Charging Review which concerns how residual network charges are applied across the electricity network.
The previous charging regime resulted in a £2.50/MWh benefit for the likes of Bluefield. That ceases from April 2021 although this is already reflected in PPA price assumptions. However, a potential charge from April 2022, which could be around £2/MWh, is still being deliberated.
Both Foresight and NextEnergy seem to have made an adjustment for this recently, but only for around 50% of the amount Bluefield is highlighting, so I’m a little puzzled as to what’s going on here. I think perhaps Foresight and NextEnergy had been accounting for the benefit element whereas Bluefield was not.
Bluefield says that as the exact method under which the charge will be made from April 2022 is still under consultation, it’s yet to include this 3p reduction its formal valuation.
Another possible adjustment could come from the fact that corporation tax rates may not reduce to 17% this year as they were originally proposed to. There’s no mention of this in these results, so I’m not clear what assumptions Bluefield is making here and whether an adjustment might be needed.
But I’m wary of the fact that any net asset value calculation like this, based on predicted revenues and expenses stretching decades ahead, is only ever going to be a best guess.
There’s always going to be a number of uncertain events or assumption changes that could shift the final number up or down. As long as the potential changes aren’t all negative and the major assumptions being made look broadly similar to other trusts in this area, then I tend to be happy.
Expanding the portfolio
Bluefield has been talking about expanding its portfolio for a while now, as the age of non-subsidised solar power approaches.
We’re edging ever closer it seems and there was a little more detail added in these latest results:
To ensure that the Company is in the best position to be active in the next phase of solar deployment in the UK the Investment Adviser has entered into discussions with a select group of developers and contractors and is actively reviewing a pipeline of c.500MWp, covering development, ready to build and storage opportunities.
The Company’s strategy remains the same, however, and it will continue to apply stringent capital discipline to ensure that only assets that are accretive to shareholders’ returns are acquired. However, it is confident that this can be achieved through a mix of carefully selected development investment, private wire or corporate PPA backed new build installations and return adjusted additions from co-located storage and solar.
Bluefield’s current portfolio is 478MWp so that’s a sizeable pipeline, although I suspect only a fraction of this will end in actual transactions.
The mention of storage assets is interesting as it would represent a departure from pure solar. I assume these would be batteries similar to those owned by Gresham House Energy Storage and Gore Street Energy Storage.
Putting it all together
I was quite surprised when I saw that Bluefield’s net asset value actually increased over the last quarter.
While it might be a little cute with its discount rate assumptions, especially given the recent fall in power prices, the underlying performance of its portfolio and the work done on extending asset lives do seem to be adding plenty of value.
It’s undoubtedly had a boost from extra sunshine in recent periods so any reversion to the mean here could dent its performance a smidgen. Last year saw below-average wind levels (something I suspect has reversed this year!) and this certainly had an impact on the other renewable trusts.
I plan to keep a close eye on what happens to the PPA prices Bluefield achieves over the next year or two. This seems much more important than the longer-term forecasts stretching out to 2050 which do seem very speculative.
Bluefield is one of my smallest positions, though, and I think it will remain that way for a little while. I wouldn’t rule out a small, opportunistic top-up, but it’s provided a little too much excitement for something I bought to help steady my portfolio!
Disclaimer
Please note that I may own some of the investments mentioned above -- you can see my current holdings on my portfolio page.
Nothing on this website should be regarded as a buy or sell recommendation as I'm just a random person writing a blog in his spare time and I am not authorised to give financial advice. Always do your own research and seek financial advice if necessary!
Subscribe to IT Investor
Get an email alert every time I publish a new article. Your email address won't be used for anything else.
Nice summary IT.
I expect you saw the news from the government yesterday that it will be unblocking onshore wind and solar to improve our chances of achieving net zero emissions by 2050. This should be a big boost for the likes of Bluefield and should counter some of the negatives.
https://www.bbc.co.uk/news/science-environment-51708817
On storage, I am hoping they will be looking at green hydrogen to link up with their solar farms and extract more value from any excess generation. Be interesting to see what they are looking into.
I think I saw the headline (busy day yesterday!) but hadn’t read the story yet. Great news.
That piece you did on green hydrogen earlier this year was very interesting. Here’s a link for those folks who missed it: http://diyinvestoruk.blogspot.com/2020/01/green-hydrogen-could-transform-world.html
Great write up .
Electricity price curves – bit different to recent reports, when nearly all indicated that the ‘independent consultants’ used were predicating rates increasing. The top couple basically saying nothing (how much did they get paid for this) whilst the grey curve – appears even more pessimistic than me. It would be great if some of the key assumptions had been listed. There is an article here on price cannibalization (over in Spain) here:
https://www.spglobal.com/marketintelligence/en/news-insights/latest-news-headlines/spain-s-red-hot-renewables-market-shows-no-signs-of-cooling-off-57337506
which is worth a read.
Guess it is a balance between more renewable power in the short/medium term keeping a lid of £/MWh before a large increase in demand (EVs, hydrogen production) later on (2030s?) would lead to higher prices.
Sympathise with the CEO about predicting prices, though: with UK gas price directionless at the moment, colder temperatures and drop in wind output combined to usher Baselaod power to £43.87/MWh on Wednesday (04/03/2020); day before, it out turned at £34.81/MWh
(Interesting day, Wednesday – cashout seen at 2,242/MWh (!):
https://www.current-news.co.uk/news/electricity-system-price-rockets-to-2-242-mwh-as-questions-raised-over-calculation-methods )
BSUoS – we touched on this disappearing for embedded generators (EBs) from April 2021 (estimate of £2.50/MWh, it is calc per hh) but my understanding is that while Ofgem considered charging EBs (and so a £5.00/MWh swing) this is not to be implemented. Must be very different for (renewable) developers to develop projects with concerns over what benefits/charges Ofgem will hand out following future consultations.
As you say, it will be interesting to see if BSIF perhaps divert some monies away from dividends and into growth & acquisitions and how this will be perceived by shareholders. Still with interest rates so low and likely to stay low for some time, then the high premia these trusts attract is likely to remain for the time being.
Thanks again for your review.
Thanks Andrew!
I guess the slump in oil prices adds another yet another complication to the forecasting mix, even though there is a commitment to move away from fossil fuels.
This is the chart I’ll probably keep one eye on, but I’m wary of chasing my tail too much on this!
