
As I near my sixth decade, I’ve started to shift my portfolio a little more towards higher income investment trusts. My most recent purchase is Bluefield Solar Income Fund, which I took a small position in following its recent results. It yields over 6% and has returned over 50% since its launch in 2013. Most intriguingly, it’s keenly eyeing up the time where unsubsidised solar power becomes a viable option in the UK.
The renewables rush
There were six renewable energy investment trusts launched in the space of about twelve months from early 2013 to early 2014. Bluefield Solar Income Fund (BSIF) is one of the best known, alongside Greencoat UK Wind (UKW). It has a few high-profile fans, such as John Baron (whose investment trust portfolios are featured in the Investors Chronicle) and James Carthew (who writes a regular column for Citywire).
2013 was a time when subsidies for solar were free-flowing and you can see the effect of that from the chart below. It illustrates the growth in solar capacity in the UK. By the way, the standard unit of measurement for solar power is megawatt peak (MWp), which reflects a plant’s maximum output.
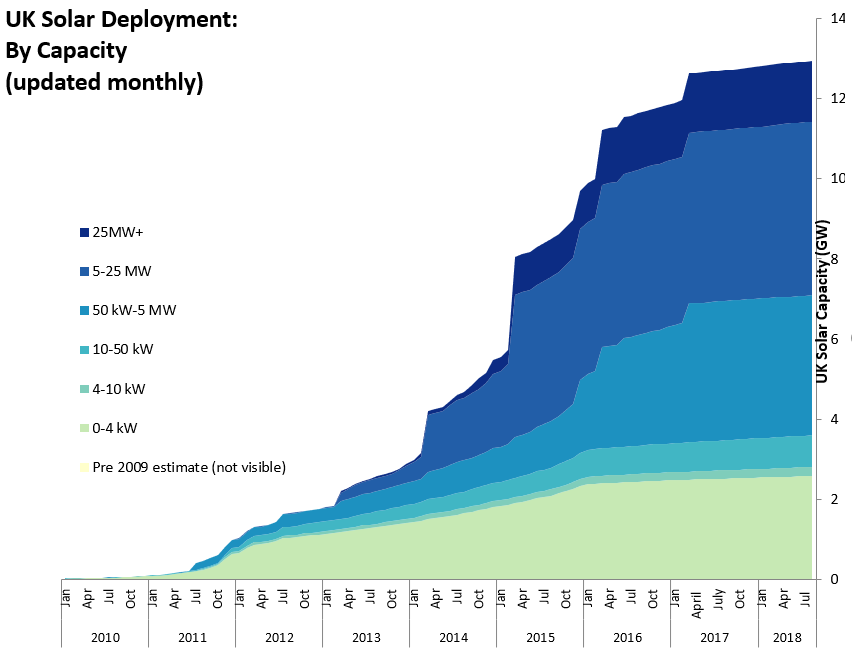
As you see, the growth in new capacity tailed off around 2016 when new subsidies effectively disappeared. Total capacity was 12.9GW as of August 2018.
Globally, the UK is the seventh largest, the major players being China, the US, Germany and Japan, with India closing in fast. Worldwide there was around 300GW of capacity installed at the end of 2016. Forecasts for the end of 2018 are for around 500GW.
The above chart also shows how the size of UK installations has grown. At the start of 2013, there was nothing over 5MW in capacity. But these days, nearly half the UK’s capacity comes from larger facilities of over 5MW. By way of comparison, the largest installation in the world, in China, is rated at 1,547MW and covers 43 square kilometres!
Bluefield Solar Income Fund’s portfolio
Most of Bluefield’s sites are 5MWp capacity or greater, with three over 25MWp and the largest being 50MWp.
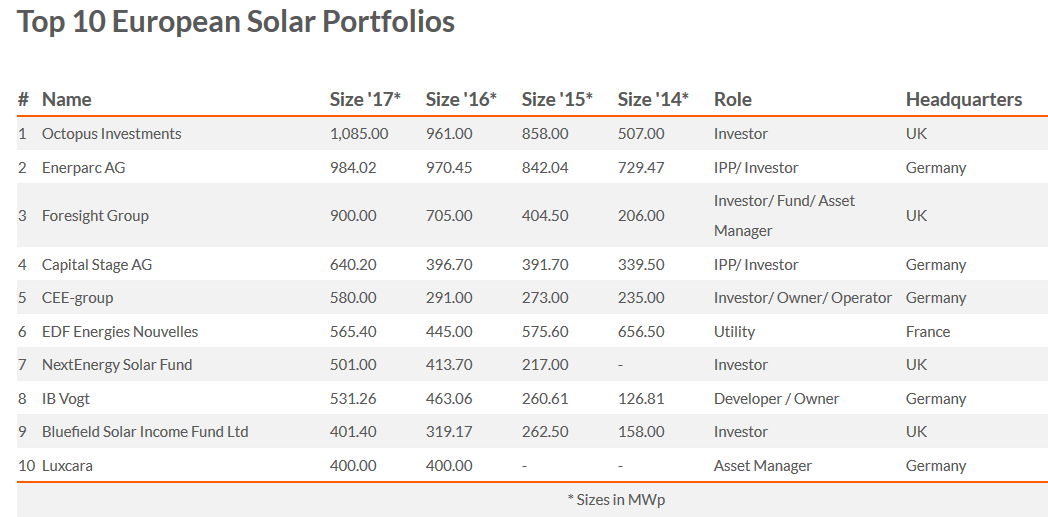
Its total portfolio is 460MWp, giving it an effective UK market share of around 3.6%. It’s one of the largest in the UK, and indeed in Europe, so you can see that this is a pretty fragmented market.
Geographically, Bluefield Solar Income’s facilities are spread across the south of England, as it’s the sunniest part of the country. Norfolk, Oxfordshire, Hampshire and Kent are the biggest four counties, accounting for some 60% between them. Overall, Bluefield boasts 45 large facilities, 39 micro, and 2 rooftops.
While it only operates in the UK at the moment, it’s left the door open to move further afield if the right opportunity arose. It would have to be a “compelling opportunity” to mitigate the “currency, regulatory and/or country risk”.
Prices paid for solar facilities
Although few, new facilities are being built, a fair number have changed hands in the last few years. Bluefield Solar Income has participated to a limited extent, adding just 19MWp of new capacity last year. Reassuringly, it seems to have a strong capital allocation discipline, as it looked at over 500MWp of potential deals.
The following chart is a little small, but it shows Bluefield’s deals in both size and price paid compared to its competitors.
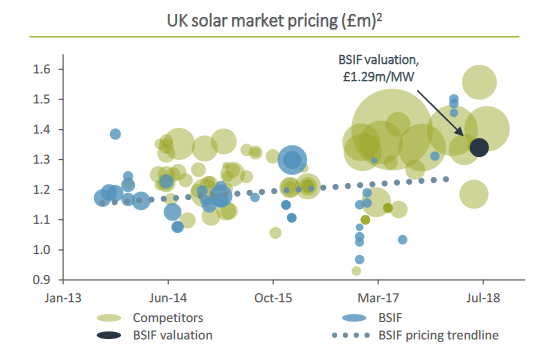
You can see that Bluefield has typically paid less than its competitors and that it amassed most of its portfolio prior to 2016. It reckons the most recent deals have taken place mostly in the range of £1.29-1.35m per MW, and it’s pleasing to see it use the bottom of this range for its net asset valuation.
460 MWp at £1.29 per MW gives a portfolio value of £593m. Add in some working capital and take off its net debt of £205m and the net asset value is £418m. Spread over 370m shares, it’s 113p.
The current share price of 121.5p represents a premium of some 7.5% to net asset value. If Bluefield threw caution to the solar wind and used £1.35 per MW, its net asset value would be 120.5p. Like all such funds, it’s been rare to see Bluefield Solar Income trade at a premium of 5% or less.
The solar business
Solar plants aren’t overly complex it would seem, with little in the way of moving parts. They do need some maintenance, though, and Bluefield has spent the last few years squeezing out operational efficiencies rather than expanding.
The following chart provides a useful summary of the revenue generation process.
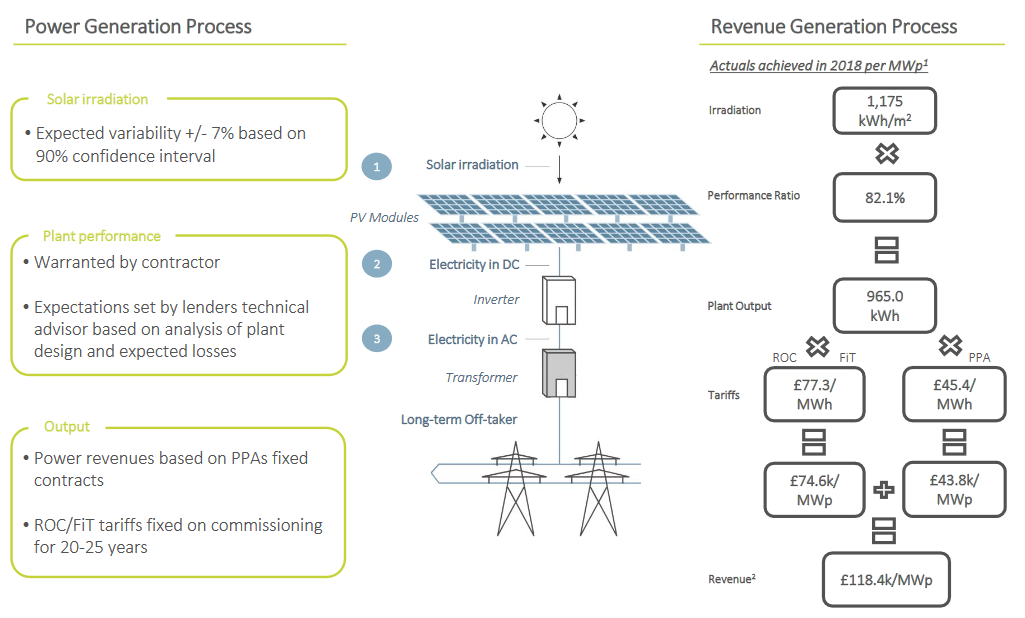
The amount of sunshine, irradiation if you want to be fancy, actually varies less than you might think. Bluefield reckons that 90% of the time it should differ by less than 7% from the average. 2018’s great summer should help the figures for next year, running to 30 June 2019, but don’t expect to see a major boost.
The performance ratio measures how effective the various plants were at converting the rays received into actual power. 82.1% was above the budgeted target of 81.5%, but below the 83.4% achieved the previous year.
It’s difficult to get a feel for how impressive this is. Some outages are planned for maintenance purposes. Others will be unscheduled due to faults. And energy is lost in any power generation process. We should expect this ratio to decline a little as the portfolio ages, too. The standard industry degradation rate is apparently 0.4% a year.
Extending the life of the portfolio
Bluefield is also hard at work extending the life of its portfolio from the standard 25 years to 40. This requires negotiation with both landowners and the planning authorities. Discussions with 28 landowners have commenced, with 8 completed so far. Planning authority discussions should take place over the coming year.
This could be a very important driver of very long-term returns, as once the initial lease term expires, an installation is essentially worthless. I’m not sure how it would work in practice, though, as presumably the subsidies won’t be extended as well.
The chart splits into two streams to reflect the regulatory revenues received and those for selling the power generated. ROC stands Renewables Obligation Certificates and covers installations over 5MW. Feed-In Tariffs (FiT) are for smaller facilities and are what you’ve probably heard being discussed when it comes to domestic solar installations. These revenues are generally fixed for the next couple of decades, and they represented about 60% of Bluefield’s income last year.
Power purchase agreements (PPA) represent the money Bluefield gets for selling the power it produces, and account for the remaining 40% of its income. These contracts are normally at fixed prices for 12-36 months, although some are longer. The prices obviously vary over time and therefore add some unpredictability to Bluefield’s future revenues.
Pumped up power prices
The good news for Bluefield Solar Income investors is that the PPA price seems to be on the rise. It’s time for another chart.
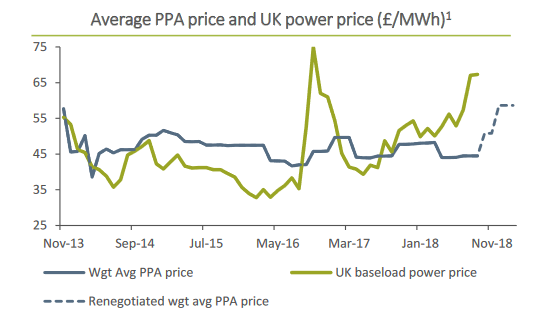
The fixed contracts mean that Bluefield’s revenues shouldn’t see the wild swings of the underlying market. The average PPA price since 2013 has been £48/MWh, but a combination of higher gas prices, lower wind levels and rising carbon prices has seen it rise recently. Over the last few months, it has been £58.
The fact that prices are fixed over a few years means it will take a while for it to feed into Bluefield’s profit and loss account. But a 20% rise in PPA prices (which are 40% of total revenues remember) could result in an eventual income increase of some 8%.
Dividends on the rise
That seems like a good time to discuss dividends.
Bluefield Solar Income paid 4p in its first year, as it ramped up its business. The next three years all came in at 7.25p. But last year saw an increase to 7.43p, with 7.68p the target for the year ending 2019. At 121.5p per share, that’s a forecast yield of 6.3%. As with many income-orientated funds, dividends are paid quarterly with the amount spread fairly evenly.
Bluefield’s strategy is to pay out all its income in dividends, so it only has 0.3p per share in remaining reserves. However, it’s worth noting that it is taking a charge against its annual income for the repayment of its long-term debt.
The main debt facility was refinanced with Aviva in 2016 and is being repaid over 18 years. £121.5m is fixed at 2.875% with £65.5m at RPI +0.7%. There is also a revolving credit facility with RBS with a maturity date of September 2019 and costing 2% over LIBOR. £24m of the available £30m was drawn down as of 30 June 2018.
So Bluefield is more highly geared than most investment trusts, but at around 33% it’s comparable to most mainstream property companies. Given the predictability of its income, this doesn’t ring any major alarm bells for me.
By the way, on the cost front, Bluefield’s 1.12% ongoing charge is lower than most renewable energy and infrastructure funds. It’s in the same ballpark as the two other solar-only funds: Foresight Solar Fund (FSFL) and NextEnergy Solar (NESF). I haven’t looked at these in any detail yet, but I plan to if I decide to dip a further toe into this sector. They are both slightly larger than Bluefield, but their returns have been lower so far.
The tipping point
It’s difficult to know how much more juice there is to be squeezed out of the existing portfolio. But the lessons learned to date should put Bluefield in a prime position for the next stage of the solar industry — when it can stand on its own two feet without any subsidies.
Here’s what Bluefield has to say:
… countries such as Spain, Portugal and Italy are taking the lead and a few projects have already started operations. In the first half of 2018, at least 12 such subsidy-free projects, totalling 676MWp have been either built or were under construction.
In the UK, over 55MWp subsidy-free solar PV capacity has been added to the grid in the first half of 2018. Out of this new capacity, 19 MWp is sub-utility scale projects and 36 MWp is utility scale. These are promising signs for the future of subsidy-free solar PV in the UK.
Here’s another chart comparing the cost of new installations to power price forecasts.
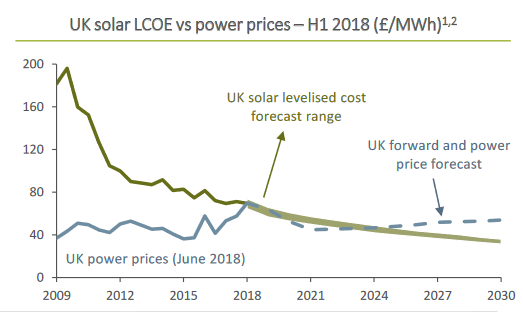
As the quip goes, all forecasts are dangerous and especially those about the future. But the continual drop in solar installation costs seems to be pretty widely acknowledged.
Crucially, the tipping point is well before 2038-2040. That’s when most of Bluefield Solar Income’s current portfolio expires. That’s ignoring its plans to add a further 15 years, of course. In theory, the fund’s value could shrink to zero by 2040, although you would hope that dividends could continue to rise until then.
Sunny side up?
How this might play out is a big unknown of course. Could we see the portfolio start increasing in size once more, with new shares issued to fund expansion? Could a new Labour government offer some additional incentives for renewable energy?
Given Bluefield’s conservative nature, I’m not expecting any headlong rush into building new sites. But it could mean they are further capital gains down the line, in addition to the high level of income it offers.
Subscribe to IT Investor
Get an email alert every time I publish a new article. Your email address won't be used for anything else.
Disclaimer
Please note that I may own some of the investments mentioned above -- you can see my current holdings on my portfolio page.
Nothing on this website should be regarded as a buy or sell recommendation as I'm just a random person writing a blog in his spare time and I am not authorised to give financial advice. Always do your own research and seek financial advice if necessary!