I took a small position in Bluefield Solar Income Fund last year and I’ve just topped up following a very pleasing set of results. It feels very apt that the sun is beating through the window behind me as I type this.
Bluefield Solar is one of the oldest renewable energy investment trusts dating all the way to the ancient times of 2013. It operates 50 solar assets which are predominantly located in the southern half of England.
It sees itself as an income fund first and foremost, looking to deliver dividends that rise each year in line with the retail prices index measure of inflation.
For the year ended June 2019, it did a little better. On top of the target dividend of 7.68p per share, an additional dividend of 0.63p was declared.
I quite like the fact it was called an “additional” dividend rather than a “special” one. The former sounds a lot less boastful.
Key stats for Bluefield Solar Income Fund
- Listed: July 2013 at 100p
- Manager: James Armstrong/Bluefield Partners
- Ticker: BSIF
- Target: Aims to grow dividends at RPI
- Recent price: 130.5p
- Indicated spread: 130p-131p (0.8%)
- Exchange market size: 3,000
- Market cap: £483m
- Premium to net assets: 10.6%
- Costs: 1.07% OCF, 1.33% KID
- Gearing: 33%
- Current dividend and yield: 7.9p (2020 target) and 6.1%
- Results released: Mar (interims) and Sep (finals)
- Dividends paid: Feb, May, Aug, Nov
- Sector: Renewable energy infrastructure
- Links: Website and AIC page
The trendy world of renewable energy
There are 12 investment trusts in the AIC’s renewable energy sector right now. Half of these, including Bluefield Solar, formed the first wave launched in 2013 and 2014. They are all very popular with investors, typically trading at premiums of around 15%.
Bluefield Solar is the smallest of this first group. That’s due to a picky approach to acquisitions and choosing to focus solely on the UK. But its exacting standards mean that it boasts the best share price return over the last five years.
Admittedly, the range of returns is not massive compared to some sectors, varying from 54% to 71%, but someone has to lead the way.
2019 in numbers
So how good was the last twelve months?
On a revenue level, the period saw 6.6% more sunshine (irradiation is the technical term) than forecast. Bluefield reckons sunshine levels should fall within a +/- 7% band 90% of the time, so 6.6% was a very favourable outcome.
UK solar panels are often calibrated to make the most of lower sunshine levels than elsewhere. On top of that, more sunshine raises operating temperatures resulting in lower efficiency. In other words, it’s not a given that x% more sunshine means x% more power is generated.
However, Bluefield Solar appears to have done very well, erm, sweating its assets. It generated 7.5% more power than forecast and 6.7% more than the previous year.
Although the majority of revenue is set at regulated levels, some 40% comes from Power Purchase Agreements (PPAs). These generally fix prices over one to three years.
This chart shows the revenue model. ROC and FiT are the regulatory regimes for larger and smaller installations respectively. MWp is megawatt-peak, denoting the capacity of a solar unit.
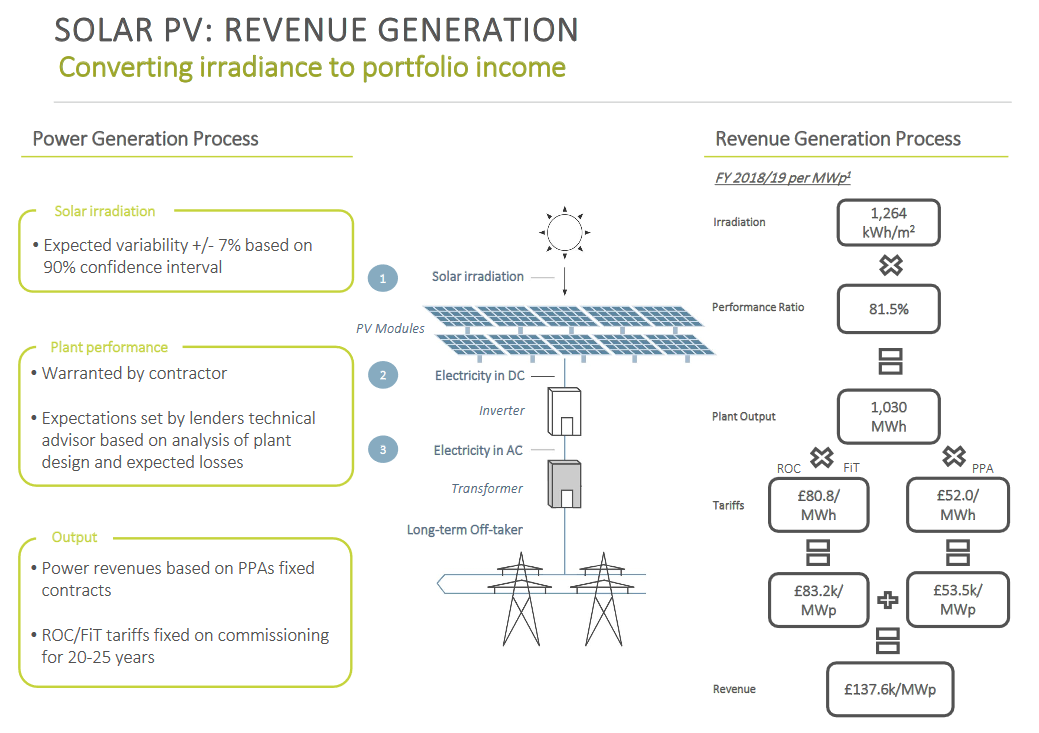
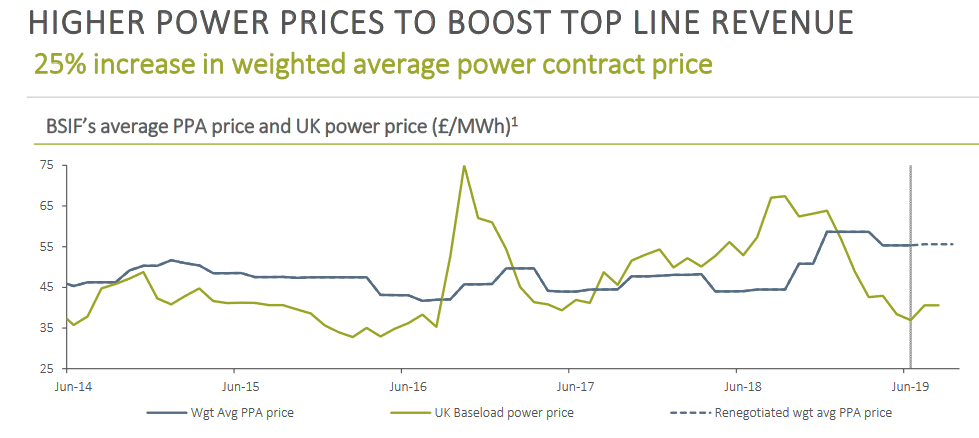
In late 2018, Bluefield took advantage of higher prices in the energy market to negotiate better PPA prices. This, plus the higher generation levels, meant that total revenue was 13.2% higher than last year.
It’s not all good news though. Power prices have fallen in 2019, with contracts for the summer of 2020 showing a reduction from £51.30 MW/h to £48.00 MW/h. So there could be a partial reversal of this situation in next year’s results.
The chart below shows the day-ahead market pricing in green compared to the more stable blue line representing the average PPA price Bluefield enjoys.
By the way, if you want more information on how the solar market works, my original article on Bluefield Solar goes into a bit more depth. This Wikipedia article is a good primer as well.
Net asset value inches ahead
There was a handy increase in net asset value from 113.3p to 118.0p. That brings the premium within touching distance of single figures.
Bluefield Solar has traded at a premium pretty much since it joined the market in 2013. But premiums of over 10% were rare before this year, and they usually occurred just before its six-monthly asset valuations were published.
A large part of the increase comes from securing lease extensions. Most of its facilities are on 25-year leases but there has been an ongoing programme to increase this to 40.
Negotiations with landowners have been completed on 20 assets, representing 193MWp out of the 465MWp that Bluefield Solar operates.
Of this 193MWp, 104MWp has been approved for planning purposes at a 100% success rate. This is what has been included in the revised net asset value calculation.
Bluefield is waiting to hear the planning decision for 63MWp and a further 36MWp is ready and waiting to be submitted. If these are all successful, it could increase net asset value by another 2.4p per share.
Negotiations with landowners are said to be ongoing with an additional 15 assets, representing another 153MWp.
It’s not clear what’s happening with the remaining 114MWp of sites over 2MWp (the lower limit Bluefield Solar set for the extension programme). It could be that Bluefield hasn’t got around to them yet, or that the landowners didn’t want to agree to any extension.
A nice surprise with the dividend
As mentioned earlier, there is an extra 0.63p dividend on the way, thanks to the excellent revenue performance over the last year.
What’s more, Bluefield Solar has also been able to add 0.3p to its distributable reserves, meaning it now has 0.6p per share stored up in case of leaner times.
The new dividend target for the year ending June 2020 is 7.9p per share. That’s an RPI uplift of 2.88% based on the figure for June 2019.
On a long-term basis for its net asset valuation calculations, Bluefield Solar expects 3.0% RPI between now and 2024 before reverting to its long-term assumption of 2.75%.
Deals dry up
Bluefield Solar spent just £6.75m on one new facility last year, down from a spend of £26.2m the year before.
Little Bear, at 5MWp, came in at £1.35m/MW which is pretty typical for the deals done over the last few years.
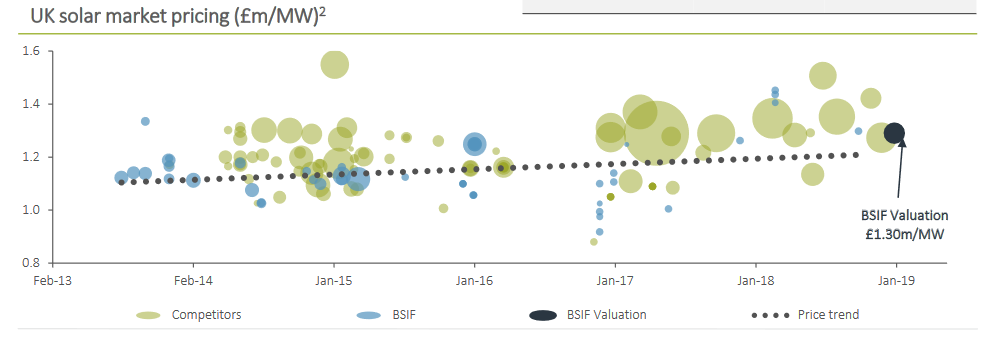
The chart shows Bluefield Solar’s purchasing discipline has been very good. The valuation metric of £1.30m/MW in its net asset value calculation also appears to be on the conservative side.
Bluefield Solar said it looked at deals for 500MWp of projects last year. The vast majority were either overpriced or of low quality. A few were recommended as potential purchases. Only Little Bear was completed, though, and that was back in October 2018.
The dawn of unsubsidised solar
But this situation may not continue indefinitely. The ever-reducing cost of solar technology means that unsubsidised facilities may soon become a reality, even in relatively gloomy places like the UK.

The crossover point for profitability shown in the left-hand chart seems a little closer than last year. It was around 2024, now it’s shifted forward a little to 2021/22. I think higher power prices might be the main reason for that, rather the cost curve shifting down.
The right-hand chart shows the pipeline for new projects is building although there has been little actual construction. Here’s Bluefield’s take:
Many of the projects that have been announced have unique characteristics (such as being local council funded, having a direct wire offtake agreement, being co-located with energy storage assets, or are small extensions on the same site as existing ROC projects). Uncertainty in the market due to Ofgem’s ongoing Targeted Charging Review and the potential revenue implications are likely to have also delayed decisions to start the construction of unsubsidised projects.
Considering these factors it is clear that innovative business models will be important in the initial stages of subsidy free deployment, but the Investment Adviser remains optimistic that a positive environment for subsidy free projects is emerging.
That seems quite guarded to me compared to comments made a year ago.
Elsewhere, it does say it is “actively reviewing a pipeline of c.300MWp covering development, ready to build and storage opportunities”. It’s also looking at increasing its gearing from the current level of 33%. Bluefield reckons it is seeing the lowest pricing in debt markets since 2016 when its existing facilities were put in place.
Something is clearly happening but we are still a little fuzzy on the extent and the timing.
Charges
There’s good and bad news here.
The basic management fee remains very competitive and ratchets down at a very swift rate. It’s 1.0% up to £100m, 0.8% between £100m and £200m, and 0.6% above that.
However, the additional dividend did trigger a variable fee which is set at 30% of the amount paid. So the basic free comes to 0.7% of net asset value and the variable element adds another 0.2%.
30% seems punchy to me, even when you consider that there is a penalty (limited to 35% of the basic fee) if the annual dividend falls short of the target.
Skin in the game
The five directors own £1.7m of shares between them, although one of them halved his holding at the start of this year.
The three founding directors of Bluefield Partners, Mssrs Armstrong, Rand, and Terranova own some £0.9m and have been adding to their positions in recent months. Part of their incentive structure can be settled in Bluefield Solar shares, so this may be the main driver for this.
In summary
This trust has done better than I expected it to. In fact, the share price got away from me a bit otherwise I may have topped up a little sooner.
It’s going to be interesting to see whether this year’s performance was more of a one-off or whether additional dividends could become a regular feature.
I’d like to see a little more clarity on how the next stage of unsubsidised solar might play out, but it’s understandable why Bluefield has only provided vague hints so far.
It could be that this trust becomes a somewhat riskier proposition. With no regulated revenues on future projects, the more volatile PPA income streams become increasingly important. But Bluefield reckons the work it has done to fine-tune its performance in recent years should leave it well placed for this next stage of solar in the UK.
Disclaimer
Please note that I may own some of the investments mentioned above -- you can see my current holdings on my portfolio page.
Nothing on this website should be regarded as a buy or sell recommendation as I'm just a random person writing a blog in his spare time and I am not authorised to give financial advice. Always do your own research and seek financial advice if necessary!
Subscribe to IT Investor
Get an email alert every time I publish a new article. Your email address won't be used for anything else.