HICL Infrastructure is the oldest UK-listed infrastructure trust and has a very respectable record of steady performance. But it’s had to stop increasing its dividend in the wake of the pandemic.
This trust is one of my plodders — a collection of three holdings (Bluefield Solar Income and Gresham House Energy Storage being the others) that I’ve bought to give my portfolio a little more steadiness.
They’re small in value terms but make a more significant contribution on the income front.
I first bought HICL in June 2018 and I’ve topped up a number of times since including twice in 2020.
I’m happy with my position size for now but I might have another nibble if it starts to look a little cheaper.
Key stats for HICL Infrastructure
- Listed: 2006
- Manager: Harry Seekings at InfraRed Capital Partners (age 47)
- Ticker: HICL
- 10-year net asset return: +140%
- Current price: 169.4p
- Indicated spread: 169.1p-169.7p (0.4%)
- Results released: May (finals) & Nov (interims)
- Market cap: £3.3bn
- Net asset value (NAV): 154p at 30 Sep 2020
- Premium to net assets: 10%
- NAV updated: every 6 months
- Costs: 1.08% OCF and 1.37% KID
- Gearing: £6m (0.2%)
- Current dividend and yield: 8.25p and 4.9%
- Dividends paid: Mar, Jun, Sep, Dec
- Sector: Infrastructure (2nd out of 4 over 10 years)
- Links: Website – AIC page – Kepler report
Price data as of 14 December.
HICL’s objectives
Nothing overly fancy here, but that’s by design:
- To deliver long term, stable income from a diversified portfolio of core infrastructure investments.
- Focused on investments at the lower end of the risk spectrum, which generate inflation correlated long-term returns.
- A long-term IRR target of 7% to 8% as set out at the IPO.
On the first point, dividend income has grown steadily from 6.1p for the year to March 2007 to 8.25p for the year to March 2020.
On the second, it’s another tick with over 100 separate infrastructure investments spread mostly across transport, health, education, and accommodation. About three-quarters of the portfolio is in the UK and roughly the same proportion consists of lower-risk Public Private Partnership (PPP) projects.
On the third, returns have been 9.0% a year since the trust first joined the market.
HICL’s dividend yield has fluctuated between 4% to 6% since its IPO, depending on the trust’s popularity at the time.
Capital growth has been a little ahead of inflation. The increase in net assets has been pretty steady with relatively small dips in 2009 and 2020:

HICL and InfraRed’s history
Originally known as HSBC Infrastructure Company Limited, the trust became known as HICL after its managers left the safe confines of HSBC to form a new asset management business called InfraRed Capital Partners.
HICL was the first of the six infrastructure trusts to list in early 2006, although International Public Partnerships (INPP) and 3i Infrastructure (3IN) weren’t far behind.
InfraRed Capital Partners started as a real estate investment division within Charterhouse Bank in 1990. It made its first infrastructure investment in 1997.
Charterhouse was swallowed up by HSBC in 2000. International expansion took place over the next decade before InfraRed was formed as an independent entity in 2011.
InfraRed launched another well-known investment trust, The Renewables Infrastructure Group (TRIG), in 2013.
In April 2019, after a couple of years of deliberation, HICL switched its domicile from Guernsey to the UK, with the old HICL Infrastructure Company Limited being replaced by HICL Infrastructure PLC.
This was done for a variety of regulatory and tax reasons which can be read in the prospectus issued at the time if you’re that way inclined.
The most immediate implication of this move for shareholders was that HICL elected for the ‘streaming regime’, meaning that part of its dividend payments are classed as interest for income tax purposes rather than dividends.
I think this only matters if you hold the shares outside of an ISA or SIPP but I’m no tax expert.
HICL reckons about 60% of its dividends will be classed as interest each year, although the exact amount varies each quarter and is set out in the relevant dividend notification.
At the end of 2019, an 80% stake in InfraRed Capital Partners was sold to Sun Life Financial for £300m.
Sun Life has the option to buy the remaining 20% in 2024. I believe InfraRed has the option to sell its stake in 2023.
InfraRed is being maintained as a separate business and brand. It currently has offices in London, Hong Kong, New York, Sydney, Seoul and Mexico City, with nearly 200 professionals and around £9bn in private funds and investment trusts.
HICL and TRIG account for around £5bn of that £9bn, so they are a significant part of InfraRed’s business. However, a key motivation behind the Sun Life deal seems to be expanding into North America so the trusts’ importance to InfraRed may diminish in future.
HICL’s acquisition strategy
HICL has built up its portfolio over time with a series of acquisitions and it’s multiple times the size it was at its IPO.
New assets are typically bought using its short-term borrowing facilities which are then repaid shortly afterwards by issuing new shares. This gives HICL more flexibility when it comes to the timing of acquisitions.
Currently, HICL has a £400m revolving credit facility that runs to May 2023 and a £60m letter of credit facility expiring in December 2026. Fully drawn these would represent a gearing level of 15%.
The projects HICL invests in are put into separate special purpose vehicles. These usually have their own borrowing to enhance returns, but there’s no recourse to HICL if an individual investment runs into financial difficulties.
Kepler reckons gearing within these vehicles could be as high as 90% but adds this is fairly typical for such deals.
The chart below shows acquisitions and the subsequent equity issuance since its IPO:
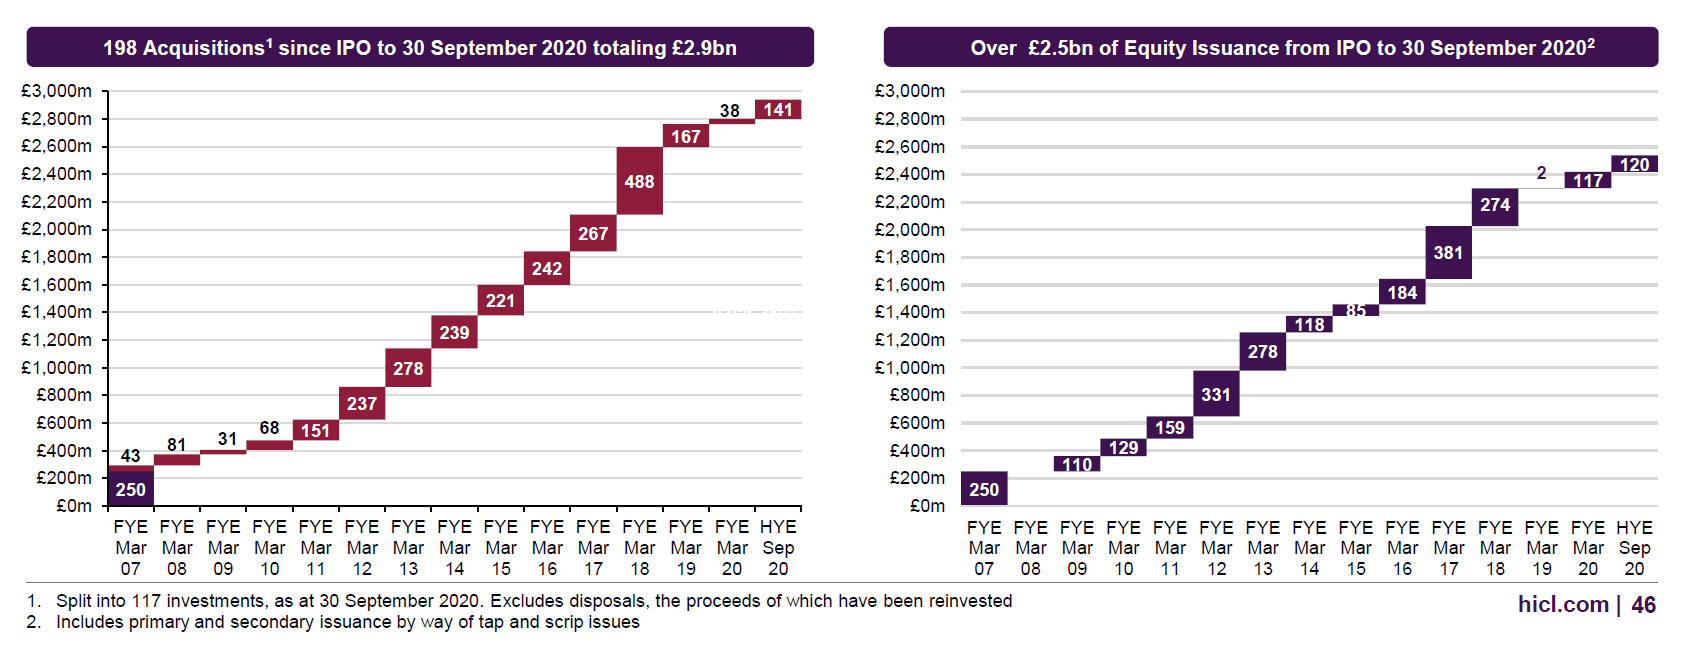
We can see that acquisitions were fairly sedate initially, picking up from 2011 to 2018.
They then slowed dramatically as political concerns over the future of PPP deals and the ownership existing projects under a potential hard-left Labour government saw HICL’s shares drop to a rare discount.
2020 has seen a bit more activity with £120m of new shares issued in June. The price paid was 164p per share (a 5.7% discount to the share price at the time) with applications said to be “scaled back materially”.
When it comes to acquisitions, HICL’s ownership stakes vary.
With smaller deals, it often takes 100%.
With larger deals, it will typically end up with a smaller stake alongside other co-investors. However, I don’t think HICL owns less than 20% of any individual project.
The trust normally buys when an asset is either being constructed or is in its first few years of operation. Sometimes it may increase its stake at a later date, buying from another partner or farm out part of its holding to other investors.
Outright asset disposals have been relatively rare. Very roughly, based purely on disposal RNS notices, £100m was realised in 2015, £150m in 2018, and £50m in 2019. Very little seems to have been sold prior to 2015.
Types of project
From its website:
HICL’s portfolio comprises over 100 investments, which are in projects across various sectors – namely Accommodation (such as government buildings or military barracks); Education; Fire, law & order; Health; Transport; and Electricity, gas & water.
These projects are located primarily in the UK, but also in Canada, France, Ireland, the Netherlands, and the USA.
The assets can also be split into the following categories:
- PPP: availability-based assets such as buildings used by various parts of the public sector.
- Demand-based: where revenues vary depending on how much the asset is used — motorway toll roads are a classic example.
- Regulated entities: utility companies, like HICL’s stake in Affinity Water, where prices tend to be set by regulatory bodies.
I think HICL has had the ability to invest in these last two categories since 2009 but it wasn’t until 2016/17 that they started to become a notable feature of its portfolio. Prior to that, HICL didn’t think the price of such assets reflected their slightly riskier nature.
As of September 2020, demand-based accounted for 19% of HICL’s portfolio and regulated for 9%.
Typically, HICL and its partners will have the concession to operate an asset for around 20-30 years. They invest in the construction phase of the project and are then able to take an income over the life of the concession.
The average life of HICL’s portfolio is currently 27.8 years but this falls to 18.6 years if you exclude Affinity Water (deemed to last for 100 years) and Northwest Parkway in the US (which runs to 2106).
Under its formal Investment Policy, no single project should account for more than 20% of its assets at the time of acquisition but the largest is currently only 7%.
And demand-based based assets plus those under construction should not exceed 35% (currently it’s 22%). In addition to this, however, HICL also has a self-imposed limit of 20% of the portfolio in demand-based assets.
Portfolio
HICL’s website and annual reports have lots of detail on the main projects it’s invested in so I won’t dwell on them here.

Although there are well over 100 investments, HICL’s portfolio is more concentrated than you might suspect with 45% in its top 10 assets.
The largest assets tend to be demand-based or regulatory:
- Affinity Water, where HICL owns 33%, has seen its value hit a little by Ofwat’s 2019 price review but HICL still likes its long-term prospects.
- The A63 motorway is in southwest France (HICL 21%) and connects Bordeaux to Spain.
- High Speed 1 (HICL 22%) is the railway link from St Pancras station in London to the Channel Tunnel.
- Northwest Parkway (HICL 33%) is “a 14km, four-lane toll road that forms part of the ring road around Denver in the US”.
Traffic on these last three demand-based assets bounced back more quickly than expected from the early stages of the pandemic. However, their long-term growth prospects were all downgraded a little when HICL released its interim results last month.
Performance from the PPP assets was said to be steady, with little impact from the pandemic.
HICL in a pickle?
It’s tough to get a handle on the health of HICL’s portfolio from its detailed financial statements but the level of cash cover for its dividends seems to be the best measure.
Put simply, it’s the number of times HICL’s payout is covered by the underlying cash flow produced by its investments. The higher the better.
The bad news is that it’s been falling in recent years:
| Year ended March | Dividend cash cover |
|---|---|
| 2015 | 1.34x |
| 2016 | 1.19x |
| 2017 | 1.22x |
| 2018 | 1.10x |
| 2019 | 1.03x |
| 2020 | 1.03x |
Now, there’s a certain lumpiness to HICL’s cash flows.
When projects near the end of their life, cash flows can jump as debt repayments normally cease a year or two before the concession to operate expires. I’m not sure if that’s a factor here.
The increase in demand-based and regulatory assets could also have had an effect.
Whatever the reason, the trend is pretty clear and, what’s more, it pre-dated the pandemic.
Cash cover was just 0.83x for the half-year to September 2020 and is expected to be 0.8-0.9x for the year to March 2021.
I must admit to not really focusing on this metric before, which seems rather careless of me. But it’s one I will be watching closely in future.
Better times ahead?
There is some good news on this front as cash flows from the portfolio look set to increase fairly significantly over the next few years. The year ending March 2022 is expected to be fully cash covered.
This chart shows the cash flows based on the current portfolio and also the expected portfolio valuation over time.

Eyeballing the chart, HICL should go from £200m of cash flows in 2022 to around £235m in 2027, followed by a big jump to £260m the year after and peaking at £300m in 2032. That’s average annual growth in the 3-4% range.
There are a load of assumptions behind this, of course, the key ones being UK GDP growth and inflation levelling off at 2% and interest rates at 1%.
HICL’s portfolio could change considerably as the years go by. New assets will no doubt be bought and others sold, altering the expected cash profile. But it still makes a good starting point on which to base expectations.
A recent Citywire article suggested HICL is currently interested in “investments in energy, citing meters and distribution as areas of interest, alongside fibre-optic communication”.
From a nerdish point of view, it’s interesting to note the decline in the portfolio valuation over time, as annual income is received from each project and the various concessions eventually expire.
By 2050, I am presuming the sole remaining major assets are Affinity Water and Northwest Parkway, with the valuation having declined from its current level of around £3bn to about £1bn.
Dividend growth grinds to a halt
HICL has been very good at setting dividend expectations, usually giving guidance for the next two years.
This time last year, the guidance for 8.25p in the year to March 2020 was reaffirmed, as was 8.45p for March 2021. New guidance of 8.65p was published for March 2022.
Then along came COVID, spoiling this and every other party.
In May 2020, the guidance for March 2021 was reduced from 8.45p to 8.25p and March 2022 was withdrawn completely.
Last month, March 2022 was re-introduced but at 8.25p, suggesting at least two years of no dividend growth.
The cash flow chart suggests a return to dividend increases is possible for 2023. I guess we’ll find out around this time next year.
The dark art of (alternative asset) valuation
It’s possible to lose yourself down the rabbit hole when it comes to the net asset value calculations for trusts like this so I’ll gloss over this aspect somewhat.
The NAVs are based on future cash flows for all current investments, discounted back to their present value.
Assumptions relating to the discount rate used and inflation/exchange/interest/tax rates only need to be altered slightly for the end result to look very different.
The discount rate is arguably the most sensitive and subjective variable in these calculations so it tends to get the most attention.
In HICL’s case, it started off at 8% in 2007 and peaked at nearly 9% around 2011 before easing back.
It’s been just over 7% for most of the past five years, falling from 7.2% to 7.0% in the latest valuation.
The few disposals HICL has completed seem to be at premiums to its most recent valuations, which is normally a reasonable sign that a prudent approach is being taken.
HICL’s NAV fell from 157.8p as of September 2019 to 152.3p in March of this year. It climbed back up to 154p as of September.
HICL vs the rest
I have to admit to never looking that closely at HICL’s sector rivals.
My original purchase centred on HICL trading close to net asset value at the time, due to political concerns, plus the length of its track record in this relatively new type of investing.
This table uses figures from the AIC:
| Company (ticker) | Manager | Premium (%) | Gearing (%) | NAV 1y (%) | NAV 3y (%) | NAV 5y (%) | NAV 10y (%) | 5y dividend growth (%pa) | Yield (%) | Market cap £m |
|---|---|---|---|---|---|---|---|---|---|---|
| Weighted average | 17 | 2 | 3 | 24 | 53 | 114 | 1.3 | 4.6 | n/a | |
| 3i Infrastructure (3IN) | 3i Investments | 18 | 0 | 11 | 51 | 90 | 217 | -1.4 | 3.3 | 2,674 |
| BBGI Global Infrastructure (BBGI) | BBGI Management | 31 | 0 | 5 | 24 | 60 | – | 4.0 | 4.1 | 1,154 |
| GCP Infrastructure (GCP) | Gravis Capital Management | 7 | 17 | 0 | 16 | 35 | 111 | 0.0 | 6.4 | 964 |
| HICL Infrastructure (HICL) | InfraRed Capital Partners | 14 | 0 | 2 | 18 | 43 | 140 | 2.5 | 4.8 | 3,316 |
| Int’l Public Partnerships (INPP) | Amber Infrastructure | 22 | 0 | 2 | 16 | 44 | 107 | 2.7 | 4.2 | 2,814 |
| Sequoia Eco. Infra. Inc. (SEQI) | Sequoia Investment Management | 7 | 6 | 1 | 17 | 40 | – | – | 5.9 | 1,760 |
All these trusts are pretty sizeable ranging from £1bn to just over £3bn in market cap.
INPP has a similar UK weighting to HICL at just over 70%.
BBGI is just 30% UK while 3IN and SEQI are 16-17%.
GCP is almost entirely UK, I believe, but invests primarily in infrastructure debt and has 60% in renewable energy. Most of the other trusts seem much more diversified by sector and invest in both equity and debt.
The performance figures over the last three and five years are fairly similar although 3IN and BBGI seem to have pulled away from the pack a little. I suspect there’s some risk/reward trade-off here.
As far as the wider world of alternative asset trusts goes, the focus since 2013 seems to have been very much on renewable energy infrastructure with 15 trusts now making up this sector.
Sequoia was the last infrastructure trust to list in March 2015. BBGI, the next youngest, was launched back in 2011.
Run of the mill charges
Most infrastructure trusts are clustered around the 1% mark (as indeed are renewable energy infrastructure trusts) so there’s little to choose between them. BBGI is the cheapest and 3IN the most expensive.
HICL’s management fee is tiered, ranging from 1.1% up to £750m of assets and 0.65% over £3bn.
That works out at just under £30m of fees on the £3bn of assets with an extra £4m in finance costs and £4m in other expenses.
Skin in the game
The eight directors owned 0.25m shares (£0.4m) as of March 2020, worth about the same as their annual salaries. One director has bought around £10,000 of shares since then.
It’s not a great show of faith although three directors have served between 5-7 years, two between 3-5 years, and three less than 3 years.
There doesn’t seem to be information on the collective holdings of InfraRed partners and staff.
In summary
HICL presents itself as a dependable, low-risk option with limited correlation to the stock market.
Its beta (a measure of how its share price moves relative to the market) has actually been increasing in recent years but it’s never been above 0.5, suggesting it’s still a decent diversifier.
While it’s not proved immune to the recent economic downturn and the political concerns of a few years ago could reappear at some point, HICL is probably the holding I worry about least in my portfolio.
I do need to keep a closer eye on that dividend cash cover metric, though. Future dividend guidance should also provide a strong signal on the underlying health of the portfolio.
Disclaimer
Please note that I may own some of the investments mentioned above -- you can see my current holdings on my portfolio page.
Nothing on this website should be regarded as a buy or sell recommendation as I'm just a random person writing a blog in his spare time and I am not authorised to give financial advice. Always do your own research and seek financial advice if necessary!
Subscribe to IT Investor
Get an email alert every time I publish a new article. Your email address won't be used for anything else.