JPMorgan Global Growth & Income is quite a mouthful but this investment trust has sneakily become one of my largest positions in the last few years.
I first bought in late 2017 and followed this up with two chunky top-ups in 2018.
After a decade in charge, the trust’s then-manager decided on a career change in early 2019. That was when I first reviewed this holding on this blog.
Having read some commentary from the new team, I made a further top-up later that year.
Admittedly, I was a little concerned about the manager change at first, given it was rather unexpected.
But the trust has done well since then — over the last two years, its net asset value is up 42% which is well ahead of the 30% produced by the global tracker I use as my main benchmark.
Key stats for JPMorgan Global Growth & Income
- Founded: 1887
- Ticker: JGGI
- Manager: Tim Woodhouse (mid-30s)
- AIC sector: Global Equity Income (1st out of 6 over 10 years)
- 10-year net asset return: +208%
- Benchmark: MSCI All Countries World Index
- Share price: 425p
- Indicated spread: 423.5p-426.5p (0.7%)
- Market cap: £634m
- Net asset value per share: 411.7p
- Premium to net asset value: 3.2%
- Costs: 0.6% OCF and 1.1% KID
- Gearing: 6% as of 16 Apr 2019 (ranges from 5% cash to 20% geared)
- Results released: Mar (interim) and Sep (final)
- Current dividend and yield: 13.16p and 3.1%
- Dividend policy: reset annually at 4% of NAV as of 30 Jun
- Dividends paid: Jan, Apr, Jul, and Oct
- Style: Global best ideas selected from JPMorgan’s 2,500 company research list
- Number of holdings: 58 (ranges from 50 to 90)
- Links: Website and AIC page
Price and related data based on 19 April 2021
History
This trust is one of the oldest in the UK dating all the way back to 1887.
It was originally called The British Steamship Investment Trust Company and was also known as United British Securities.
Up until 1982, it adopted a generalist approach with a heavy bias towards UK-listed stocks. In 1982, it was renamed Fleming Overseas and refocused on global equities, as remains the case today.
JPMorgan Chase took over Fleming in 2000 and the trust was renamed JPMorgan Overseas.
In 2016, in response to a widening discount, the trust announced a new dividend policy, setting its payout at 4% of net asset value as of 30 June each year.
The trust’s name was changed again to its current moniker of JPMorgan Global Growth & Income.
A number of other JPMorgan investment trusts have since adopted a similar dividend strategy and followed the “Growth & Income” branding.
While a lot of the managers of JPMorgan trusts have served in excess of 20 years, there’s been a fair amount of change at JPMorgan Global Growth & Income.
Peter Harrison ran things from 1998 to 2004, followed by Ed Walker from 2004 to 2008. Jeroen Huysinga had a longer stint from 2008 to 2019 before the three-man team of Helge Skibeli, Rajesh Tanna, and Tim Woodhouse were appointed.
Woodhouse is the youngest of the three co-managers and had been working with Huysinga as joint manager since 2017. He appears to be taking more of a lead role recently, including representing the trust in a Citywire webinar this month.
Woodhouse has worked at JPMorgan since leaving university in 2008, initially as a media & telecoms analyst before moving into fund management in 2014. He’s currently based in New York.
Investing style
This trust is never going to win any prizes for excitement but that’s ok with me.
Although it’s classed as an income trust, it doesn’t particularly seek stocks that pay a high income. Instead, it pays out a fixed percentage of its net asset value each year, topping up any income received from its investments by tapping into its capital reserves.
In the sector jargon, this is called an enhanced dividend policy.
Essentially it’s a ‘best ideas’ portfolio so it’s not taking any particular stance on economies or sectors, preferring the ‘bottom-up’ method of choosing companies on their own merit.
The managers base their choices on around 2,500 companies covered by 85 JPMorgan analysts around the globe. This is then whittled down into the 50-90 best ideas.
The recent Citywire webinar I mentioned earlier adds a little colour to the selection process. I’ve edited this section a little:
We look at it, really, through three lenses. The first is economics. Does the business create value for their shareholders? We want to see, over time, a sustained return on capital above the cost of capital. We’ll look at things like capital intensity, we’ll look at cash flow generation.
Can they sustain those returns? This brings in all manner of questions. It can bring in environmental and social factors, whether those are opportunities or risks … Think about so many companies that we could discuss today, that didn’t exist 15 years ago and companies that were very large 15 years ago that we really don’t talk about anymore. We have to understand whether the value creation is sustained and we do that again, for every single one of the companies that we cover.
Then, governance is key. We do not want to invest with management teams that we don’t trust … This is about the sensible allocation, whether that is sensible M&A, whether that’s return on capital to shareholders in the form of dividends or buybacks. We want to understand the rationale of why companies are doing what they’re doing.
I think the sustainability angle seems to more prominent now than it was under the previous manager.
The portfolio seems to be getting a little more concentrated, too. The end of February 2021 portfolio contained 58 positions, near the bottom of the stated 50-90 range.
Three years ago, there were 75 positions and not that many of them remain in the portfolio today.
Portfolio turnover was pretty high in the years ended June 2019 and June 2020 with £470m of investments sold in both years, representing 110% and 102% of average net assets respectively.
Portfolio turnover seemed a little lower in the half-year to December 2020, down to around 40% of net assets sold over six months.
Performance
One remarkable thing about this trust is just how closely it’s tracked its benchmark over the last two decades.
It uses the MSCI All Countries World Index so that’s the wider definition that includes both developed and emerging markets, covering 50 countries in total.
This index is dominated by the US of course (57%), followed by Japan (6%), then China and the UK (a little over and a little under 4% respectively).
In the decade to June 2010, i.e. the Nasty Noughties, JPMorgan Global Growth & Income returned 12.6% on a net asset basis with its benchmark falling 6.2%.
But pretty much all that outperformance came from falling less than the market in 2008 and recovering a little quicker in 2009.
In the decade to June 2020, the trust returned 189% on a net asset basis which was a little lower than its benchmark’s 191%.
This chart shows just how little the trust’s net asset value deviated from its benchmark over this period:
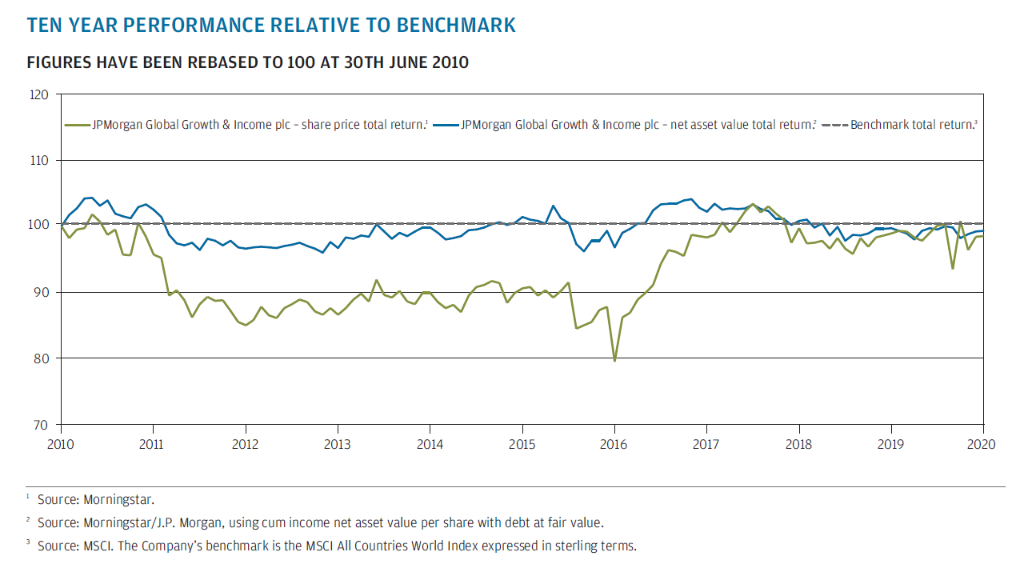
The green line shows that the trust’s share price performance has been much more volatile, as you would expect.
You can also see the way the new dividend policy turned what had become a 15% discount into a small premium. The trust has consistently traded at a premium between 1% and 3% for nearly four years now.
Drilling down into stock selection
One nice touch is how performance for each period is broken down into its various components. Here’s the latest showing the six months to December 2020.

This makes it relatively easy to look at stock selection in isolation to see what value is being added.
4.1% over a 6-month period is pretty impressive for a trust of this type so I’ll be interested to see if this momentum can be continued.
It sounds like the managers have shifted towards value plays in the last several months and this has driven the recent purple patch of outperformance.
So far in 2021, the trust’s net asset value is up 11.0% versus 7.2% for a global tracker.
The stock selection figures for recent years since this measure has been shown in annual reports are:
- June 2020: +1.3%
- June 2019: -1.6%
- June 2018: -1.2%
- June 2017: +7.2%
- June 2016: -4.3%
So from mid-2015 to mid-2019 stock selection essentially netted out at zero.
Portfolio
The portfolio as of February 2021 had 58 positions with 32% in the top 10 holdings.
Here’s everything over 1.5% to give you a flavour:
| Company | Weighting as of Feb-21 |
|---|---|
| Alphabet | 5.0% |
| Microsoft | 4.6% |
| Amazon.com | 4.2% |
| NXP Semiconductors | 2.9% |
| Analog Devices | 2.8% |
| Samsung Electronics | 2.8% |
| Coca-Cola | 2.6% |
| Adidas | 2.6% |
| Mastercard | 2.5% |
| ConocoPhillips | 2.5% |
| Schneider Electric | 2.4% |
| Boston Scientific | 2.2% |
| Lyft | 2.2% |
| Comcast | 2.1% |
| Wells Fargo | 2.1% |
| Vinci | 2.1% |
| Applied Materials | 2.1% |
| Yum Brands | 2.0% |
| Booking Holdings | 2.0% |
| Prologis Inc Reit | 2.0% |
| Abbvie | 1.9% |
| Zimmer Biomet | 1.9% |
| Safran | 1.8% |
| Toyota Motor | 1.8% |
| BNP Paribas | 1.7% |
| Volkswagen Preference | 1.7% |
| Norfolk Southern | 1.7% |
| Morgan Stanley | 1.7% |
| Novo Nordisk | 1.5% |
| Eastman Chemical | 1.5% |
| American Express | 1.5% |
There are 10 positions under 1% but just one under 0.5% so there’s not a long tail of tiddly positions.
The Citywire webinar featured Woodhouse’s views on three stocks in the portfolio:
- Vinci (2.1%) – Toll roads, airports, and contracting (increasingly renewable energy construction)
- Ping An (1.0%) – Chinese life insurer
- Nextera Energy (0.7%) – solar and wind power generation
All three are fairly minor positions at the moment but they could indicate the direction of travel, looking at trends like the shift towards renewable energy and the increasing importance of emerging market consumers.
However, it’s also clear that Woodhouse is likely to steer clear of high valuations and high risk/high reward situations like Tesla.
In company size terms, there’s a roughly equal split between greater than $100bn and $10bn-$100bn. Only 1% of the trust is invested in companies valued at less than $10bn.
By country, the trust is currently overweight the US and Europe and underweight the UK, Canada, Japan, and emerging markets.
By sector, reflecting the current tilt towards value, it’s overweight Industrial Cyclicals, Automobiles & Parts, and Consumer Cyclicals. Software seems to be the biggest underweight.
Dividends
The introduction of the 4% of net assets dividend policy in 2016 certainly seems to have raised this trust’s profile with investors.
And with the current net asset value of 411p, there could be a healthy uplift in the payout when the dividend level is reset a few months from now.
Most of the dividend comes from capital, with income per share in the last two years in the region of 4p to 5p whereas the payout has been around 13p.
Of course, dividend policies like this are yet to be tested in a prolonged bear market. They might then turn out to be less attractive to investors, converting the small premium into a discount.
You could argue that because it’s a manufactured yield, with the trust not seeking income-based investments to fund it, JGGI should also be compared to the Global sector rather than Global Equity Income.
That would change its position over the last decade from 1st out of 6 to 8th out of 17, putting it ahead of the likes of Witan and Brunner but just behind Mid Wynd and Alliance Trust.
The trust’s share count has increased from 124 million to 149 million since the dividend policy came into force with the premium to net assets enabling regular new issuance to soak up investor demand.
With the discount disappearing and markets continuing to rise, the trust’s market cap has risen 144% from £260m to £634m, making it more attractive to larger investors.
Gearing
The official policy is that gearing can range from 5% cash to 20% borrowed with the Board deciding on the appropriate level guided by the portfolio managers’ views on markets.
Mid to high single digits seems to be normal gearing level in most years but there is some variation such as when it was reduced to zero on valuation concerns before COVID became a thing.
That proved fortuitous and gearing remained at that low level until it started to increase again throughout October and November 2020 to its current level of 6%.
Gearing is achieved primarily through two loan notes:
- £30m in 30-year notes expiring in 2048, charging 2.93%
- £20m in 15-year notes expiring in 2036, charging 2.36%.
The trust publishes its gearing figure weekly for those who like to monitor this metric more closely.
Charges
There’s a base fee of 0.4% of gross assets plus a 15% performance fee on any returns 0.5% higher than the benchmark. The performance fee is paid over a four-year period and held back if there’s subsequent underperformance.
Over the last ten years, the ongoing charge has averaged 0.61% without the performance fee and 0.78% with it.
I’d say that’s about average to maybe slightly on the high side for a £600m trust.
But it does illustrate the, er, quirks of performance fees as shareholders have ended up paying a little bit extra despite the fact performance for the decade as a whole was marginally below its benchmark.
The Key Information Documents puts costs at 1.1% breaking down as follows:
- Portfolio transaction costs: 0.45%
- Management fee: 0.40% (no performance fee was due for this period)
- Other costs of administration: 0.11%
- Costs of borrowing: 0.17%
Skin in the game
The directors own £0.5m in shares although just over two-thirds of these are held by Chairman Nigel Wightman who is retiring from the Board later this year. Tristan Hillgarth, a director since 2014, will replace him as Chairman.
One director, Gay Collins, who has been on the Board since 2012, has bought a few shares in the past year but the most recent appointments, Sarah Whitney (Jan 2020) and James Macpherson (Apr 2021), are yet to dip into their pockets.
There’s no information provided as to whether any of the trust’s managers own any shares.
In summary
Despite the fact it pays most of its dividends from capital and trades at a small premium, I’d put this trust at the conservative end of my global holdings.
But I think it’s fair to say that when I first bought into this trust I researched my positions in less detail than I do today. It struggled against global markets initially, maybe partly because the then lead manager was distracted about his impending career change.
However, it still did better than other global holdings I’ve since disposed of, such as Caledonia and Murray International, so I largely left it to do its thing to see how things played out.
The recent uptick in performance is pleasing but I’m waiting to see if it persists. While the trust has become more concentrated, it may be just a good market call relating to the post-pandemic economic recovery. To my mind, such things are difficult to repeat on a regular basis.
A number of other JPMorgan investment trusts have put in good performances recently and also have good long-term track records so that gives me confidence this is a firm with a decent pool of talent to choose from.
My position size here is definitely larger than I envisaged a few years ago when I first bought in, so I may trim it a little if something else looks more attractive. In the meantime, the enhanced dividend policy throws off a little extra cash so I can use that to satisfy any rampant trading rebalancing urges.
And with many of my fund managers getting rather long in the tooth, it’s good to have someone considerably younger that is looking after one of my positions to mix things up a bit.
Disclaimer
Please note that I may own some of the investments mentioned above -- you can see my current holdings on my portfolio page.
Nothing on this website should be regarded as a buy or sell recommendation as I'm just a random person writing a blog in his spare time and I am not authorised to give financial advice. Always do your own research and seek financial advice if necessary!
Subscribe to IT Investor
Get an email alert every time I publish a new article. Your email address won't be used for anything else.
Just took a position in this trust.
Tim, one of the managers, is very convincing and income from total return is appealing.
One third natural yield, two thirds income from capital seems to be the split.
Tim also mentioned that they had multiple decades of capital reserves to keep paying 4% of year end nav.
Whilst we know this is just a book keeping entry, i would be interested in your thoughts on this, if we entered a 1999 to 2003 falling markets period.
Excellent article as always.
Thanks, Peter.
Yes, as there are oodles of capital reserves the trust can keep on paying out in down markets. Whether it makes sense to do so is a different question.
4% is the same as the Safe Withdrawal Rate that underpins a lot of Financial Independence Retire Early (FIRE) portfolios so there’s a certain logic to it being at that level. You can quibble whether it’s a bit too low or too high, but it’s in the same ballpark.
However, if markets have fallen heavily and stay depressed for a while, two-thirds of the dividend might be coming from selling investments at rock-bottom prices which isn’t ideal.
You could argue dividends may not fall as far as prices in such markets, so perhaps the one-third/two-thirds split becomes nearer to, say, half and half. Also, the trust can cherry-pick any disposals needed to fund the dividend by getting rid of its least favourite positions.
And there is always the option of tweaking the dividend policy for a short period although I suspect this would be a last resort.
So I think they are ways around this problem. As long as investors are aware of how the dividend is being created and size their positions accordingly then that should help matters, too.
If anything, the weird markets that we’ve had in the past year will have made these dividend policies even more popular. I think it’s almost unheard for dividends in the broader market to collapse as they did yet for share prices to move higher. So, these enhanced dividend payers have seen their payouts increase while a few more traditional income trusts have had to trim theirs back.
But the fact remains that these policies are relatively new and while they have been popular so far, investing fashions do change over time.
Obviously, if the NAV falls for a few years in succession, that would mean falling dividends as well and that could turn people off, meaning the small premium disappears and becomes a discount.
It’s a tricky one. I’ve got this trust plus IBT, BBH and BVT that follow a similar strategy. None of them are looking for income investments per se, so you have to be prepared for their dividends to be a lot more volatile than other trusts and plan accordingly.
Just as a follow-up on the subject of enhanced dividend policies, it looks Invesco Perpetual Smaller Companies has re-instated its 4% target today after dropping it this time last year.
https://investegate.co.uk/invesco-perpetual-uk-smaller-c–ipu-/prn/annual-financial-report/20210423070000P6178/
Hello – I have held JGGI for several years and been happy enough with its performance with the blend of Cap growth and income which is what I like from an IT and there aren’t many that provide this combination .
Just been reading about the combination of JGGI and SCIN and unsure if this is a good thing or not as a JGGI holder. I see SCIN shares have jumped.
I read fees will be reduced , which is good , but performance is higher priority to me as I do not want to pay less and get less .
Is bigger better?
Cheers
Roy
Hi Roy
The basic fees should come down under this deal and the performance fee is being scrapped as well, which should boost returns a little too.
Given the size of companies that JGGI invests in, I’m not expecting there to be any material change in its portfolio as a result of adding the SCIN assets, even though the size of the fund is roughly doubling.
SCIN has jumped because it was previously trading at a fairly wide discount and that should effectively be eliminated when the two combine. However, JGGI has stayed at roughly the same premium level suggesting it should, largely, be business as normal. That could change over time, though, if the size of the enlarged fund means there aren’t enough buyers of JGGI shares to keep it at the same small premium that we’ve seen in recent years. Difficult to know if that will happen though – we’ll just have to wait and see.
Hope that helps!
Thanks for another great write-up.
One query with JGGI (maybe I missed it – I try not to think too much on Sundays!) and the dividend policy aiming to pay 4% of NAV – I do wonder what will happen in any year where the share price might have fallen significantly? Do they try and maintain the dividend or accept that the dividend will be reduced? Dividend payments with most trusts are much more steady than capital values so it is worth considering.
Hi Mark,
I think they would probably reduce it although I believe the NAV has risen each year since they adopted this policy in 2016 so we haven’t seen an actual example yet.
Other trusts with these enhanced dividend policies seem to cut their dividends when their NAVs fall so I would expect JGGI to follow suit.
So it’s something to be aware of relative to other trusts who largely tend to have progressive policies and avoid cuts where possible.
Sorry to resurrect this, but I’m currently trying to build a portfolio inside a limited company (where dividends are received effectivlely tax free) and trying to get as close as I can to a world tracker but receiving as high a yield as possible. JGGI looks perfect! Are there any other global ITs that pay a fixed % of NAV as a dividend? It’s exactly what I want…
Hi Will,
I don’t think there are any other global trusts that pay enhanced dividends. There are a few in the Asia Pacific and Japan sectors, biotech/healthcare, and private equity. JPMorgan use the policy for several of their trusts. The AIC site now includes “Dividend Policy” on its website so you can check relatively easily:
https://www.theaic.co.uk/companydata/jpmorgan-asia-growth-income/dividends
There are a number of other trusts in the Global Equity Income sector, like Murray International, Henderson International Income, and Scottish American that don’t set dividend targets but do offer a higher yield than most mainstream global trusts. Of course, the question is whether you sacrificing long-term returns by focusing a little more on income.
You may have seen it already but there was a recent article on Monevator that looked at investing via a limited company which may be of interest.
https://monevator.com/family-investment-company-frequently-asked-questions-the-fic-faq/
Thanks, that was my exact thought.
Something like MYI is the classic income play, where it’s mostly/all covered and it’s ‘genuine’ yield. The tracker equivalent would be VHYL.
JGGI is more alike to VWRL, but with amplified yield. It’s able to hold/target growth where MYI can’t.
Unless I’m completely wrong!