With many of us looking to invest ISA allowances, either for the current tax year or the forthcoming one, the seemingly enormous discounts many trusts trade at might seem very enticing. But it’s worth remembering that not all discounts are equal.
Unlike other types of funds, the prices of investment trusts can be different from the underlying net asset values of their underlying investments.
Traditionally, most trusts have traded at a discount. But as their popularity has increased over the last few decades, the average discount has shrunk considerably, although progress has certainly not been smooth.
Here’s an old chart showing that:
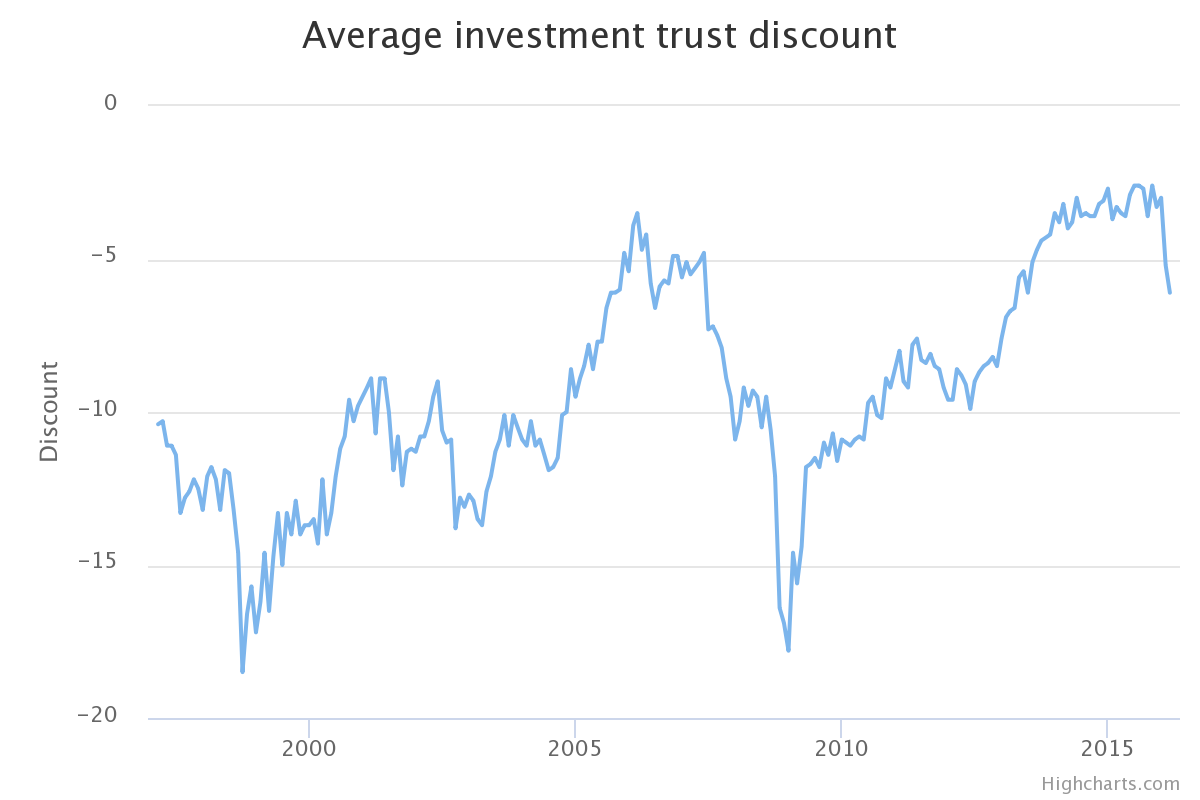
Since the end date of this chart, discounts have continued to narrow until they reached an average of 1.3% at the end of 2019. I think that was an all-time low. If it wasn’t, it probably wasn’t far off.
Enter COVID-19…
According to the AIC website, the average discount figure increased to nearly 11% as of 30 March 2020. However, some sources, like this FT article, reckoned it was as much as 22% a week before that.
Hold your horses!
We can see from the chart that discounts often widen sharply at times of crisis.
The Asian/Long-Term Capital Management crisis in the late 1990s saw a steep dip. The global financial crisis caused an even greater slide.
In both these cases, the effect was relatively short-lived, although it probably didn’t seem so at the time!
But it’s worth bearing in mind that trusts publish updated net asset values at vastly different intervals and this can distort the average discount when share prices move quickly.
For example, in my portfolio, I have 5 trusts that publish their net asset values daily and 1 that does so twice a week.
Then I have 4 more that update monthly, 4 on a quarterly basis and 1 semi-annually.
Full and partial updates
Daily updaters typically just invest in publicly quoted vehicles so getting up-to-date prices for all their holdings should be simple.
Monthly updaters usually have a mixture of quoted vehicles and less liquid/privately-held investments. The valuations of the latter are usually very subjective and often based on assumptions made by management teams.
It may be that those privately held investments are only fully revalued on a quarterly or even semi-annual basis, so net asset values published in interim months should be taken with a pinch of salt.
Most trusts will give some indication of what approach they are taking. For example, HGCapital Trust used wording like this before it switched from monthly to quarterly updates:
Please note, all information is unaudited. The investment portfolio has not been revalued at 30 November 2018. The unaudited NAV at 30 November 2018 is based on the NAV at 30 June 2018, adjusted to reflect purchases and realisations of investments, exchange rate movements, market prices (at bid) in respect of quoted investments, the revaluation of the carried interest provision, any dividends payable and expenses incurred during the period.
Trusts that update quarterly usually consist of just privately held/illiquid investments. Even then you might find that a full revaluation is done every six months, with only partial updates made for the quarters in between.
Bluefield Solar uses this sort of language:
The Company’s NAV at 30 September 2019 reflects the adoption of the most recent power curves published by the Company’s two independent power forecasters (which the Company blends on a 50/50 basis) as well as working capital movements over the quarter. The NAV update also includes power price contracts fixed in the period to 30 September 2019 and as well inclusion of an additional 50MWp (c150MWp in total) now valued on the basis of 40 year asset life. All other core valuation assumptions have remained consistent with the NAV issued in the Company’s financial statements for the period ending 30 June 2019.
Averages can be deceiving
That’s a rather long way of saying be a little careful when you see an average discount quoted for all investment trusts. It’s going to contain a mixture of figures that could be between one day and several months old.
The problem has become even more acute in recent years with the non-stop rise of trusts investing in alternative assets like fixed income, property, infrastructure, renewable energy, and so on. The vast majority of these publish net asset values quarterly.
Right now, the average trust figure will contain a large proportion of figures that were last updated as of 31 December 2019, well before the recent crash.
When these next trusts get revalued as of 31 March 2020, and these figures probably won’t be published until May in most cases, we’ll probably see that the actual average discount is a lot lower. Of course, if prices move significantly in April and May, the March net asset values might still be way off.
Handle with care
The main thing I try to do with discounts is not to get too cute. I tend to suspicious of anything that looks too good to be true, especially if a trust’s net asset value hasn’t been updated recently.
In practice, I tend to use discounts as a tiebreaker when there are a few, different trusts I’d like to buy.
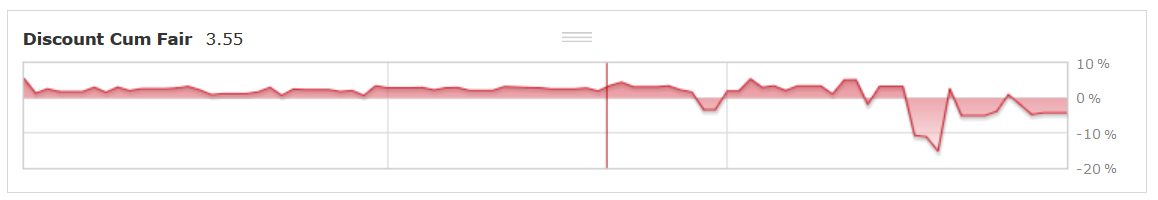
However, even those trusts that update their NAVs daily need to be treated with a little caution when prices are frequently moving by 10% either way during a single session.
Here’s the discount chart for JPMorgan Global Growth & Income for 2020. For the first couple of months, it consistently traded at a small premium. Most recently, the discount has moved wildly from day to day.
I tend to go to sites like the London Stock Exchange and get the latest NAV figure that’s published via RNS. This will be as of the market close the preceding day so I compare it to the closing price that day rather than the current share price to estimate what the latest discount might be.
Of course, if the share price has moved up or down today by more than the wider stock market then that creates a further problem.
If it’s a UK smaller company fund, I might look at the FTSE 250 and FTSE Smallcap index movement instead as that can be quite different than the FTSE 100.
Of course, you can get discount figures on sites like the AIC or Morningstar but I don’t think these typically include any figure published that day. So, if you look on a Friday you might see the discount as of the close of trade on Wednesday.
Most sites seem to quote the date of the NAV, which helps you double-check any figure they display.
Others display an estimated NAV, which usually seems to adjust for any dividend paid since the NAV date rather than any general market movement (edit: see this comment below from David at the AIC for more on this).
Summing up
I’m still deciding how to deploy my ISA cash for 2020/21 but I suspect I will split up my contribution into maybe half a dozen trusts, investing half straight away and the rest a few weeks later.
I’m giving myself permission to miss the bottom on the basis that I expect markets to be materially higher five years from now.
The size of any trust discounts may tilt my hand one way or the other. Most of the daily updaters I’m looking that seem to have discounts between 5-10% greater than they did before the crash. While that’s a significant move, I wouldn’t class it as ‘back up the truck’ territory.
The ones that only update monthly or quarterly have probably seen similar moves, but I won’t know for sure for a little while. Some of these trusts have already issued mini-updates, giving me a bit of a steer.
One thing I defintitely don’t plan to do is to hang around, checking net asset values every day, until there’s a spectacularly wide discount on any trust I’m looking to buy.
Disclaimer
Please note that I may own some of the investments mentioned above -- you can see my current holdings on my portfolio page.
Nothing on this website should be regarded as a buy or sell recommendation as I'm just a random person writing a blog in his spare time and I am not authorised to give financial advice. Always do your own research and seek financial advice if necessary!
Subscribe to IT Investor
Get an email alert every time I publish a new article. Your email address won't be used for anything else.
“Of course, you can get discount figures on sites like the AIC or Morningstar but I don’t think these typically include any figure published that day. So, if you look on a Friday you might see the discount as of the close of trade on Wednesday.
Most sites seem to quote the date of the NAV, which helps you double-check any figure they display.
Others display an estimated NAV, which usually seems to adjust for any dividend paid since the NAV date rather than any general market movement.”
Hi There, Great blog!
Just to confirm. The AIC take estimated NAVs and associated discounts from Morningstar which do take into account market movements. So on a Friday after 08:30 you will see Thursday’s closing share price for the investment company and the Thursday’s closing NAV estimate from Morningstar based upon market movements of all the holdings (including currency, dilutions, corporate actions etc.) and then the discount based upon both those figures. You can then wait until later on the Friday to see how accurate their NAV estimates were.
We totally take your point regarding the reporting lag and have a note on the AIC site saying exactly that.
Back to NAV estimates I believe the Morningstar site actually has intra-day estimates. Perhaps with a 30 minute delay, whereas as I said above the AIC site only takes end of day, once a day. I *think* Morningstar are the only players to offer NAV estimates so if you see them on the HL site for example they are done on the same basis. Although there may be timing issues, e.g. some get NAVs after Asia opens rather than end of previous day.
David (AIC)
Thanks for that extra info, David. I never realised the adjustments made were that complicated! I have linked to your comment in the text.
No problem. And I should add that Morningstar only attempt to estimate equity funds. For alternatives such as property, private equity or infrastructure they only change estimates for corporate actions and dividends not for any underlying holdings valuations.